Misc
Mapped: Countries by Alcohol Consumption Per Capita

var divElement = document.getElementById(‘viz1710540551170’); var vizElement = divElement.getElementsByTagName(‘object’)[0]; vizElement.style.width=’1200px’;vizElement.style.height=’2094px’; var scriptElement = document.createElement(‘script’); scriptElement.src = ‘https://public.tableau.com/javascripts/api/viz_v1.js’; vizElement.parentNode.insertBefore(scriptElement, vizElement);
Mapped: Countries by Alcohol Consumption Per Capita
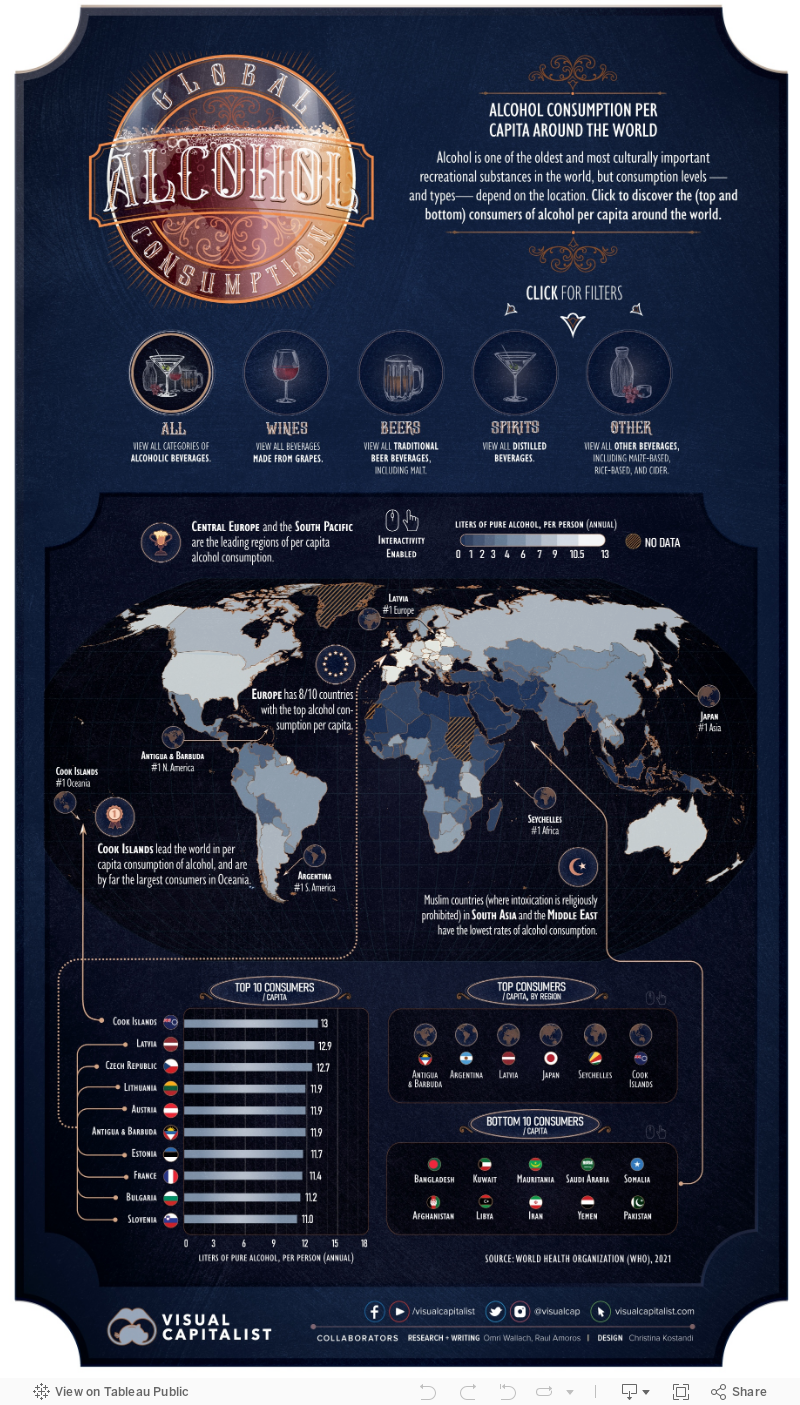
Alcohol might be one of the oldest and most frequently used recreational substances in the world, but examining countries by alcohol consumption shows that usage is not equal.
Consumption levels, and types of alcohol consumed, vary widely based on location. Furthermore, the availability of fruits and grains used in alcohol production impacts which drinks are more commonly consumed, as does the predominant culture. Some cultures see alcohol consumption as a pleasurable experience, while others see intoxication as a sin.
There’s also the question of economics and availability. It’s strange, but in some regions of the world, industrially mass-produced alcohol can flood markets and become cheaper than other beverages, including water.
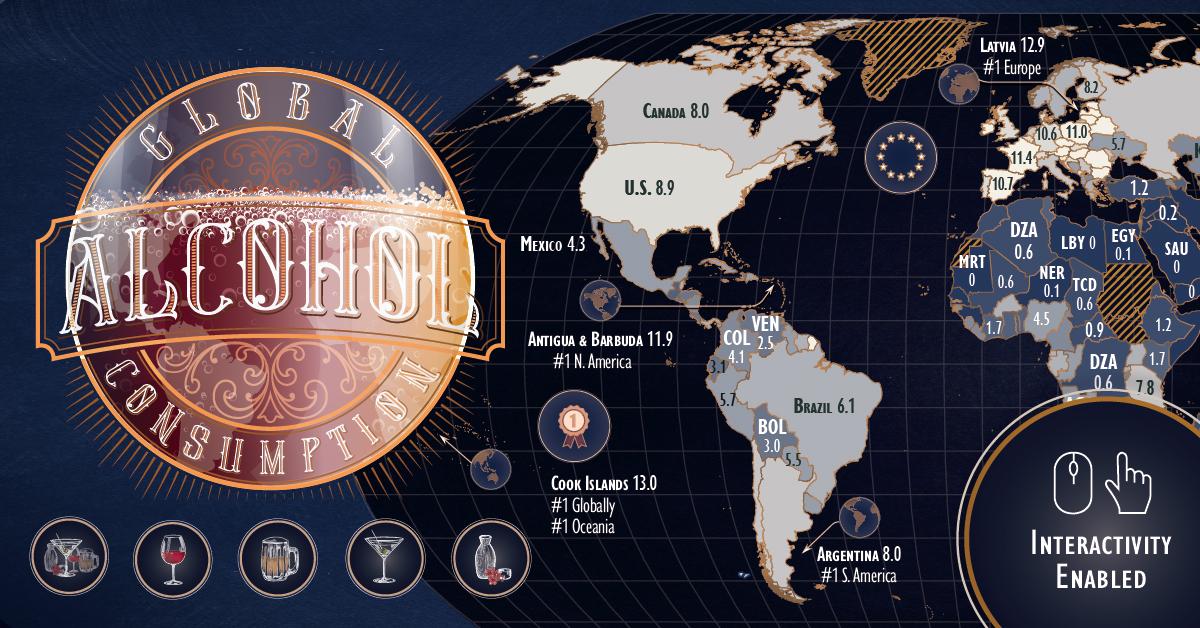
When we map alcohol consumption by capita, and by different types of alcohol, these local and cultural stories come to light. The above maps use recorded consumption data from WHO for 2019, in liters of pure alcohol.
Europe Leads in Per Capita Alcohol Consumption
The top 10 countries by alcohol consumption highlight the prominence of alcoholic beverages in European culture.
Eight of the 10 countries with the top alcohol consumption per capita were in Europe. Primarily, they were Eastern and Central European countries, including #2 Latvia, #3 Czech Republic, #4 Lithuania, and #5 Austria.
But the crown of alcohol consumption per capita goes to the Cook Islands, which leads the world with an annual per capita consumption of 13L (3.4 gallons) of alcohol.
| Location | 2019 Alcohol consumption/capita (L) |
|---|---|
| Cook Islands | 12.97 |
| Latvia | 12.90 |
| Czech Republic | 12.73 |
| Lithuania | 11.93 |
| Austria | 11.90 |
| Antigua and Barbuda | 11.88 |
| Estonia | 11.65 |
| France | 11.44 |
| Bulgaria | 11.18 |
| Slovenia | 11.05 |
| Luxembourg | 11.00 |
| Andorra | 10.99 |
| Romania | 10.96 |
| Poland | 10.96 |
| Ireland | 10.91 |
| Hungary | 10.79 |
| Spain | 10.72 |
| Belarus | 10.57 |
| Germany | 10.56 |
| Portugal | 10.37 |
| Slovakia | 10.30 |
| Barbados | 9.94 |
| Montenegro | 9.91 |
| UK | 9.80 |
| Cyprus | 9.64 |
| Croatia | 9.64 |
| Australia | 9.51 |
| Seychelles | 9.48 |
| Bahamas | 9.48 |
| Switzerland | 9.41 |
| Saint Lucia | 9.30 |
| New Zealand | 9.17 |
| Denmark | 9.16 |
| Belgium | 9.15 |
| U.S. | 8.93 |
| Saint Kitts and Nevis | 8.84 |
| Grenada | 8.62 |
| Niue | 8.50 |
| Japan | 8.36 |
| Netherlands | 8.23 |
| Finland | 8.23 |
| Lao People's Democratic Republic | 8.15 |
| Malta | 8.07 |
| Canada | 8.00 |
| Argentina | 7.95 |
| United Republic of Tanzania | 7.81 |
| Chile | 7.80 |
| South Korea | 7.74 |
| Iceland | 7.72 |
| Eswatini | 7.68 |
| Italy | 7.65 |
| Saint Vincent and the Grenadines | 7.48 |
| Serbia | 7.45 |
| Republic of Moldova | 7.45 |
| Georgia | 7.45 |
| Russian Federation | 7.29 |
| Burkina Faso | 7.28 |
| South Africa | 7.21 |
| Sweden | 7.10 |
| Thailand | 6.86 |
| Uganda | 6.82 |
| Suriname | 6.60 |
| Panama | 6.54 |
| Gabon | 6.47 |
| Rwanda | 6.35 |
| Greece | 6.33 |
| Dominica | 6.32 |
| Brazil | 6.12 |
| Equatorial Guinea | 6.11 |
| Norway | 6.05 |
| Botswana | 5.98 |
| Belize | 5.93 |
| Angola | 5.84 |
| Trinidad and Tobago | 5.81 |
| Peru | 5.74 |
| Congo | 5.74 |
| Ukraine | 5.69 |
| Dominican Republic | 5.56 |
| Paraguay | 5.47 |
| Mongolia | 5.46 |
| Bosnia and Herzegovina | 5.46 |
| Uruguay | 5.42 |
| Guyana | 5.11 |
| Philippines | 4.85 |
| Cuba | 4.70 |
| Cabo Verde | 4.70 |
| Cambodia | 4.56 |
| Nigeria | 4.49 |
| China | 4.48 |
| Albania | 4.40 |
| Mexico | 4.25 |
| Sao Tome and Principe | 4.23 |
| Colombia | 4.09 |
| Cameroon | 4.09 |
| Burundi | 4.07 |
| Kyrgyzstan | 4.02 |
| Macedonia | 3.90 |
| Zambia | 3.82 |
| Armenia | 3.77 |
| Kazakhstan | 3.73 |
| Nicaragua | 3.69 |
| North Korea | 3.61 |
| Lesotho | 3.56 |
| Jamaica | 3.46 |
| Viet Nam | 3.41 |
| Mauritius | 3.39 |
| Sierra Leone | 3.22 |
| Guinea-Bissau | 3.21 |
| Liberia | 3.12 |
| Zimbabwe | 3.11 |
| India | 3.09 |
| Israel | 3.07 |
| Costa Rica | 3.07 |
| Ecuador | 3.05 |
| Bolivia | 2.98 |
| El Salvador | 2.94 |
| Turkmenistan | 2.88 |
| Haiti | 2.85 |
| Honduras | 2.73 |
| Fiji | 2.71 |
| Gambia | 2.67 |
| Sri Lanka | 2.58 |
| Venezuela | 2.51 |
| Uzbekistan | 2.45 |
| Nauru | 2.44 |
| Namibia | 2.38 |
| Samoa | 2.18 |
| Myanmar | 2.06 |
| Malawi | 2.04 |
| United Arab Emirates | 2.03 |
| Singapore | 1.81 |
| Côte d’Ivoire | 1.70 |
| Kenya | 1.68 |
| Guatemala | 1.63 |
| Vanuatu | 1.60 |
| Micronesia | 1.59 |
| Ghana | 1.59 |
| Tunisia | 1.51 |
| Mozambique | 1.46 |
| Togo | 1.40 |
| Maldives | 1.38 |
| Azerbaijan | 1.38 |
| Papua New Guinea | 1.26 |
| Benin | 1.25 |
| Solomon Islands | 1.19 |
| Turkey | 1.18 |
| Bahrain | 1.18 |
| Ethiopia | 1.16 |
| Lebanon | 1.14 |
| Qatar | 0.96 |
| Central African Republic | 0.94 |
| Tuvalu | 0.93 |
| Eritrea | 0.93 |
| Madagascar | 0.89 |
| Tajikistan | 0.85 |
| Brunei Darussalam | 0.69 |
| Malaysia | 0.64 |
| Mali | 0.60 |
| Algeria | 0.59 |
| Democratic Republic of the Congo | 0.56 |
| Chad | 0.55 |
| Morocco | 0.51 |
| Oman | 0.47 |
| Kiribati | 0.43 |
| Timor-Leste | 0.41 |
| Nepal | 0.36 |
| Guinea | 0.33 |
| Tonga | 0.31 |
| Senegal | 0.25 |
| Jordan | 0.25 |
| Djibouti | 0.21 |
| Comoros | 0.18 |
| Iraq | 0.16 |
| Egypt | 0.14 |
| Syrian Arab Republic | 0.13 |
| Niger | 0.11 |
| Indonesia | 0.08 |
| Bhutan | 0.07 |
| Pakistan | 0.04 |
| Yemen | 0.02 |
| Iran | 0.02 |
| Libya | 0.01 |
| Afghanistan | 0.01 |
| Somalia | 0 |
| Saudi Arabia | 0 |
| Mauritania | 0 |
| Kuwait | 0 |
| Bangladesh | 0 |
At the bottom of the consumption charts? Not surprisingly, it’s Bangladesh, Saudi Arabia, Kuwait, and other Muslim countries where intoxication is religiously prohibited.
Regional Disparities in Alcohol Consumption
Per capita consumption of alcohol also highlights clear regional preferences in amount and type, or a lack of interest.
The biggest consumers of alcohol are countries in Central Europe, the South Pacific, and parts of the Caribbean. In Europe, beer and wine are kings, with most of the top consumers also being top producers such as France and Germany.
Spirits like rum, meanwhile, are dominant in the Cook Islands and much of the Caribbean, which has four of the 12 top spirit consumers. The others are mainly in Eastern Europe and Russia, which get most of their alcohol consumption from vodka.
| Top Consuming Country by Alcohol | Type | Consumption/Capita |
|---|---|---|
| Czech Republic | Beer | 6.77L |
| France | Wine | 6.44L |
| Cook Islands | Spirits | 7.07L |
| Tanzania | Others | 6.60L |
The importance of local crops couldn’t be overstated. Regions like Africa and Asia that struggle with the right conditions for grapes or hops saw higher consumption of “other” distilled drinks.
These include rice alcohol in South Korea and Japan, and drinks made from sugarcane, molasses, and even bananas in African countries like Tanzania.
Unlike goods like coffee or tea, alcohol can be produced from many different grains, fruits, or sources of sugar that can be fermented—so it’s natural that regional differences in types, amounts, and even cultural importance would arise.
But as one of the world’s most widely used recreational drugs, it’s played a storied role throughout history that is certain to continue evolving.


Misc
How Hard Is It to Get Into an Ivy League School?
We detail the admission rates and average annual cost for Ivy League schools, as well as the median SAT scores required to be accepted.


How Hard Is It to Get Into an Ivy League School?
This was originally posted on our Voronoi app. Download the app for free on iOS or Android and discover incredible data-driven charts from a variety of trusted sources.
Ivy League institutions are renowned worldwide for their academic excellence and long-standing traditions. But how hard is it to get into one of the top universities in the U.S.?
In this graphic, we detail the admission rates and average annual cost for Ivy League schools, as well as the median SAT scores required to be accepted. The data comes from the National Center for Education Statistics and was compiled by 24/7 Wall St.
Note that “average annual cost” represents the net price a student pays after subtracting the average value of grants and/or scholarships received.
Harvard is the Most Selective
The SAT is a standardized test commonly used for college admissions in the United States. It’s taken by high school juniors and seniors to assess their readiness for college-level academic work.
When comparing SAT scores, Harvard and Dartmouth are among the most challenging universities to gain admission to. The median SAT scores for their students are 760 for reading and writing and 790 for math. Still, Harvard has half the admission rate (3.2%) compared to Dartmouth (6.4%).
| School | Admission rate (%) | SAT Score: Reading & Writing | SAT Score: Math | Avg Annual Cost* |
|---|---|---|---|---|
| Harvard University | 3.2 | 760 | 790 | $13,259 |
| Columbia University | 3.9 | 750 | 780 | $12,836 |
| Yale University | 4.6 | 760 | 780 | $16,341 |
| Brown University | 5.1 | 760 | 780 | $26,308 |
| Princeton University | 5.7 | 760 | 780 | $11,080 |
| Dartmouth College | 6.4 | 760 | 790 | $33,023 |
| University of Pennsylvania | 6.5 | 750 | 790 | $14,851 |
| Cornell University | 7.5 | 750 | 780 | $29,011 |
*Costs after receiving federal financial aid.
Additionally, Dartmouth has the highest average annual cost at $33,000. Princeton has the lowest at $11,100.
While student debt has surged in the United States in recent years, hitting $1.73 trillion in 2023, the worth of obtaining a degree from any of the schools listed surpasses mere academics. This is evidenced by the substantial incomes earned by former students.
Harvard grads, for example, have the highest average starting salary in the country, at $91,700.

-

 Maps2 weeks ago
Mapped: Average Wages Across Europe
-

 Money1 week ago
Which States Have the Highest Minimum Wage in America?
-

 Real Estate1 week ago
Ranked: The Most Valuable Housing Markets in America
-

 Markets1 week ago
Charted: Big Four Market Share by S&P 500 Audits
-

 AI1 week ago
The Stock Performance of U.S. Chipmakers So Far in 2024
-

 Automotive2 weeks ago
Almost Every EV Stock is Down After Q1 2024
-

 Money2 weeks ago
Where Does One U.S. Tax Dollar Go?
-

 Green2 weeks ago
Ranked: Top Countries by Total Forest Loss Since 2001