Misc
Mapped: Countries by Alcohol Consumption Per Capita

var divElement = document.getElementById(‘viz1710540551170’); var vizElement = divElement.getElementsByTagName(‘object’)[0]; vizElement.style.width=’1200px’;vizElement.style.height=’2094px’; var scriptElement = document.createElement(‘script’); scriptElement.src = ‘https://public.tableau.com/javascripts/api/viz_v1.js’; vizElement.parentNode.insertBefore(scriptElement, vizElement);
Mapped: Countries by Alcohol Consumption Per Capita
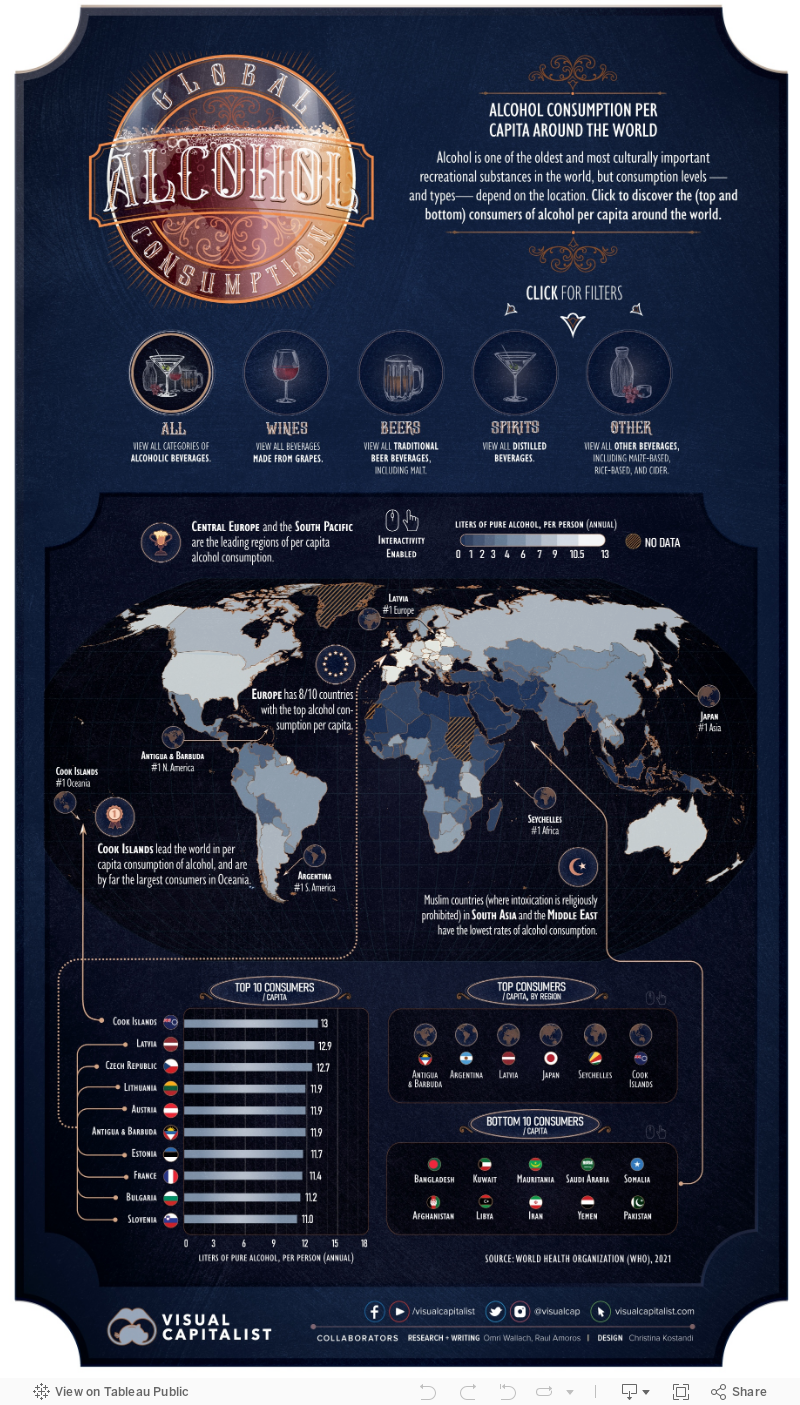
Alcohol might be one of the oldest and most frequently used recreational substances in the world, but examining countries by alcohol consumption shows that usage is not equal.
Consumption levels, and types of alcohol consumed, vary widely based on location. Furthermore, the availability of fruits and grains used in alcohol production impacts which drinks are more commonly consumed, as does the predominant culture. Some cultures see alcohol consumption as a pleasurable experience, while others see intoxication as a sin.
There’s also the question of economics and availability. It’s strange, but in some regions of the world, industrially mass-produced alcohol can flood markets and become cheaper than other beverages, including water.
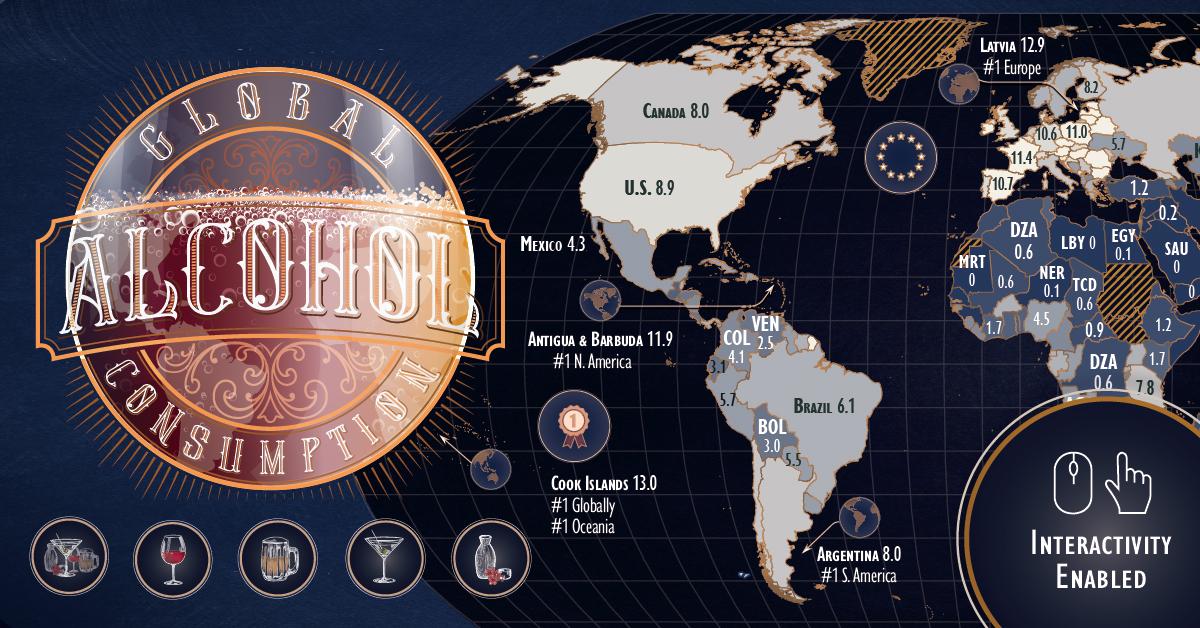
When we map alcohol consumption by capita, and by different types of alcohol, these local and cultural stories come to light. The above maps use recorded consumption data from WHO for 2019, in liters of pure alcohol.
Europe Leads in Per Capita Alcohol Consumption
The top 10 countries by alcohol consumption highlight the prominence of alcoholic beverages in European culture.
Eight of the 10 countries with the top alcohol consumption per capita were in Europe. Primarily, they were Eastern and Central European countries, including #2 Latvia, #3 Czech Republic, #4 Lithuania, and #5 Austria.
But the crown of alcohol consumption per capita goes to the Cook Islands, which leads the world with an annual per capita consumption of 13L (3.4 gallons) of alcohol.
| Location | 2019 Alcohol consumption/capita (L) |
|---|---|
| Cook Islands | 12.97 |
| Latvia | 12.90 |
| Czech Republic | 12.73 |
| Lithuania | 11.93 |
| Austria | 11.90 |
| Antigua and Barbuda | 11.88 |
| Estonia | 11.65 |
| France | 11.44 |
| Bulgaria | 11.18 |
| Slovenia | 11.05 |
| Luxembourg | 11.00 |
| Andorra | 10.99 |
| Romania | 10.96 |
| Poland | 10.96 |
| Ireland | 10.91 |
| Hungary | 10.79 |
| Spain | 10.72 |
| Belarus | 10.57 |
| Germany | 10.56 |
| Portugal | 10.37 |
| Slovakia | 10.30 |
| Barbados | 9.94 |
| Montenegro | 9.91 |
| UK | 9.80 |
| Cyprus | 9.64 |
| Croatia | 9.64 |
| Australia | 9.51 |
| Seychelles | 9.48 |
| Bahamas | 9.48 |
| Switzerland | 9.41 |
| Saint Lucia | 9.30 |
| New Zealand | 9.17 |
| Denmark | 9.16 |
| Belgium | 9.15 |
| U.S. | 8.93 |
| Saint Kitts and Nevis | 8.84 |
| Grenada | 8.62 |
| Niue | 8.50 |
| Japan | 8.36 |
| Netherlands | 8.23 |
| Finland | 8.23 |
| Lao People's Democratic Republic | 8.15 |
| Malta | 8.07 |
| Canada | 8.00 |
| Argentina | 7.95 |
| United Republic of Tanzania | 7.81 |
| Chile | 7.80 |
| South Korea | 7.74 |
| Iceland | 7.72 |
| Eswatini | 7.68 |
| Italy | 7.65 |
| Saint Vincent and the Grenadines | 7.48 |
| Serbia | 7.45 |
| Republic of Moldova | 7.45 |
| Georgia | 7.45 |
| Russian Federation | 7.29 |
| Burkina Faso | 7.28 |
| South Africa | 7.21 |
| Sweden | 7.10 |
| Thailand | 6.86 |
| Uganda | 6.82 |
| Suriname | 6.60 |
| Panama | 6.54 |
| Gabon | 6.47 |
| Rwanda | 6.35 |
| Greece | 6.33 |
| Dominica | 6.32 |
| Brazil | 6.12 |
| Equatorial Guinea | 6.11 |
| Norway | 6.05 |
| Botswana | 5.98 |
| Belize | 5.93 |
| Angola | 5.84 |
| Trinidad and Tobago | 5.81 |
| Peru | 5.74 |
| Congo | 5.74 |
| Ukraine | 5.69 |
| Dominican Republic | 5.56 |
| Paraguay | 5.47 |
| Mongolia | 5.46 |
| Bosnia and Herzegovina | 5.46 |
| Uruguay | 5.42 |
| Guyana | 5.11 |
| Philippines | 4.85 |
| Cuba | 4.70 |
| Cabo Verde | 4.70 |
| Cambodia | 4.56 |
| Nigeria | 4.49 |
| China | 4.48 |
| Albania | 4.40 |
| Mexico | 4.25 |
| Sao Tome and Principe | 4.23 |
| Colombia | 4.09 |
| Cameroon | 4.09 |
| Burundi | 4.07 |
| Kyrgyzstan | 4.02 |
| Macedonia | 3.90 |
| Zambia | 3.82 |
| Armenia | 3.77 |
| Kazakhstan | 3.73 |
| Nicaragua | 3.69 |
| North Korea | 3.61 |
| Lesotho | 3.56 |
| Jamaica | 3.46 |
| Viet Nam | 3.41 |
| Mauritius | 3.39 |
| Sierra Leone | 3.22 |
| Guinea-Bissau | 3.21 |
| Liberia | 3.12 |
| Zimbabwe | 3.11 |
| India | 3.09 |
| Israel | 3.07 |
| Costa Rica | 3.07 |
| Ecuador | 3.05 |
| Bolivia | 2.98 |
| El Salvador | 2.94 |
| Turkmenistan | 2.88 |
| Haiti | 2.85 |
| Honduras | 2.73 |
| Fiji | 2.71 |
| Gambia | 2.67 |
| Sri Lanka | 2.58 |
| Venezuela | 2.51 |
| Uzbekistan | 2.45 |
| Nauru | 2.44 |
| Namibia | 2.38 |
| Samoa | 2.18 |
| Myanmar | 2.06 |
| Malawi | 2.04 |
| United Arab Emirates | 2.03 |
| Singapore | 1.81 |
| Côte d’Ivoire | 1.70 |
| Kenya | 1.68 |
| Guatemala | 1.63 |
| Vanuatu | 1.60 |
| Micronesia | 1.59 |
| Ghana | 1.59 |
| Tunisia | 1.51 |
| Mozambique | 1.46 |
| Togo | 1.40 |
| Maldives | 1.38 |
| Azerbaijan | 1.38 |
| Papua New Guinea | 1.26 |
| Benin | 1.25 |
| Solomon Islands | 1.19 |
| Turkey | 1.18 |
| Bahrain | 1.18 |
| Ethiopia | 1.16 |
| Lebanon | 1.14 |
| Qatar | 0.96 |
| Central African Republic | 0.94 |
| Tuvalu | 0.93 |
| Eritrea | 0.93 |
| Madagascar | 0.89 |
| Tajikistan | 0.85 |
| Brunei Darussalam | 0.69 |
| Malaysia | 0.64 |
| Mali | 0.60 |
| Algeria | 0.59 |
| Democratic Republic of the Congo | 0.56 |
| Chad | 0.55 |
| Morocco | 0.51 |
| Oman | 0.47 |
| Kiribati | 0.43 |
| Timor-Leste | 0.41 |
| Nepal | 0.36 |
| Guinea | 0.33 |
| Tonga | 0.31 |
| Senegal | 0.25 |
| Jordan | 0.25 |
| Djibouti | 0.21 |
| Comoros | 0.18 |
| Iraq | 0.16 |
| Egypt | 0.14 |
| Syrian Arab Republic | 0.13 |
| Niger | 0.11 |
| Indonesia | 0.08 |
| Bhutan | 0.07 |
| Pakistan | 0.04 |
| Yemen | 0.02 |
| Iran | 0.02 |
| Libya | 0.01 |
| Afghanistan | 0.01 |
| Somalia | 0 |
| Saudi Arabia | 0 |
| Mauritania | 0 |
| Kuwait | 0 |
| Bangladesh | 0 |
At the bottom of the consumption charts? Not surprisingly, it’s Bangladesh, Saudi Arabia, Kuwait, and other Muslim countries where intoxication is religiously prohibited.
Regional Disparities in Alcohol Consumption
Per capita consumption of alcohol also highlights clear regional preferences in amount and type, or a lack of interest.
The biggest consumers of alcohol are countries in Central Europe, the South Pacific, and parts of the Caribbean. In Europe, beer and wine are kings, with most of the top consumers also being top producers such as France and Germany.
Spirits like rum, meanwhile, are dominant in the Cook Islands and much of the Caribbean, which has four of the 12 top spirit consumers. The others are mainly in Eastern Europe and Russia, which get most of their alcohol consumption from vodka.
| Top Consuming Country by Alcohol | Type | Consumption/Capita |
|---|---|---|
| Czech Republic | Beer | 6.77L |
| France | Wine | 6.44L |
| Cook Islands | Spirits | 7.07L |
| Tanzania | Others | 6.60L |
The importance of local crops couldn’t be overstated. Regions like Africa and Asia that struggle with the right conditions for grapes or hops saw higher consumption of “other” distilled drinks.
These include rice alcohol in South Korea and Japan, and drinks made from sugarcane, molasses, and even bananas in African countries like Tanzania.
Unlike goods like coffee or tea, alcohol can be produced from many different grains, fruits, or sources of sugar that can be fermented—so it’s natural that regional differences in types, amounts, and even cultural importance would arise.
But as one of the world’s most widely used recreational drugs, it’s played a storied role throughout history that is certain to continue evolving.


VC+
VC+: Get Our Key Takeaways From the IMF’s World Economic Outlook
A sneak preview of the exclusive VC+ Special Dispatch—your shortcut to understanding IMF’s World Economic Outlook report.

Have you read IMF’s latest World Economic Outlook yet? At a daunting 202 pages, we don’t blame you if it’s still on your to-do list.
But don’t worry, you don’t need to read the whole April release, because we’ve already done the hard work for you.
To save you time and effort, the Visual Capitalist team has compiled a visual analysis of everything you need to know from the report—and our upcoming VC+ Special Dispatch will be available exclusively to VC+ members on Thursday, April 25th.
If you’re not already subscribed to VC+, make sure you sign up now to receive the full analysis of the IMF report, and more (we release similar deep dives every week).
For now, here’s what VC+ members can expect to receive.
Your Shortcut to Understanding IMF’s World Economic Outlook
With long and short-term growth prospects declining for many countries around the world, this Special Dispatch offers a visual analysis of the key figures and takeaways from the IMF’s report including:
- The global decline in economic growth forecasts
- Real GDP growth and inflation forecasts for major nations in 2024
- When interest rate cuts will happen and interest rate forecasts
- How debt-to-GDP ratios have changed since 2000
- And much more!

Get the Full Breakdown in the Next VC+ Special Dispatch
VC+ members will receive the full Special Dispatch on Thursday, April 25th.
Make sure you join VC+ now to receive exclusive charts and the full analysis of key takeaways from IMF’s World Economic Outlook.
Don’t miss out. Become a VC+ member today.
What You Get When You Become a VC+ Member
VC+ is Visual Capitalist’s premium subscription. As a member, you’ll get the following:
- Special Dispatches: Deep dive visual briefings on crucial reports and global trends
- Markets This Month: A snappy summary of the state of the markets and what to look out for
- The Trendline: Weekly curation of the best visualizations from across the globe
- Global Forecast Series: Our flagship annual report that covers everything you need to know related to the economy, markets, geopolitics, and the latest tech trends
- VC+ Archive: Hundreds of previously released VC+ briefings and reports that you’ve been missing out on, all in one dedicated hub
You can get all of the above, and more, by joining VC+ today.

-

 Markets1 week ago
U.S. Debt Interest Payments Reach $1 Trillion
-

 Business2 weeks ago
Charted: Big Four Market Share by S&P 500 Audits
-

 Real Estate2 weeks ago
Ranked: The Most Valuable Housing Markets in America
-

 Money2 weeks ago
Which States Have the Highest Minimum Wage in America?
-

 AI2 weeks ago
Ranked: Semiconductor Companies by Industry Revenue Share
-

 Markets2 weeks ago
Ranked: The World’s Top Flight Routes, by Revenue
-

 Demographics2 weeks ago
Population Projections: The World’s 6 Largest Countries in 2075
-

 Markets2 weeks ago
The Top 10 States by Real GDP Growth in 2023