Markets
Mapped: Corruption in Countries Around the World
For more detail, view the full-sized version of this infographic


Mapped: Corruption in Countries Around the World
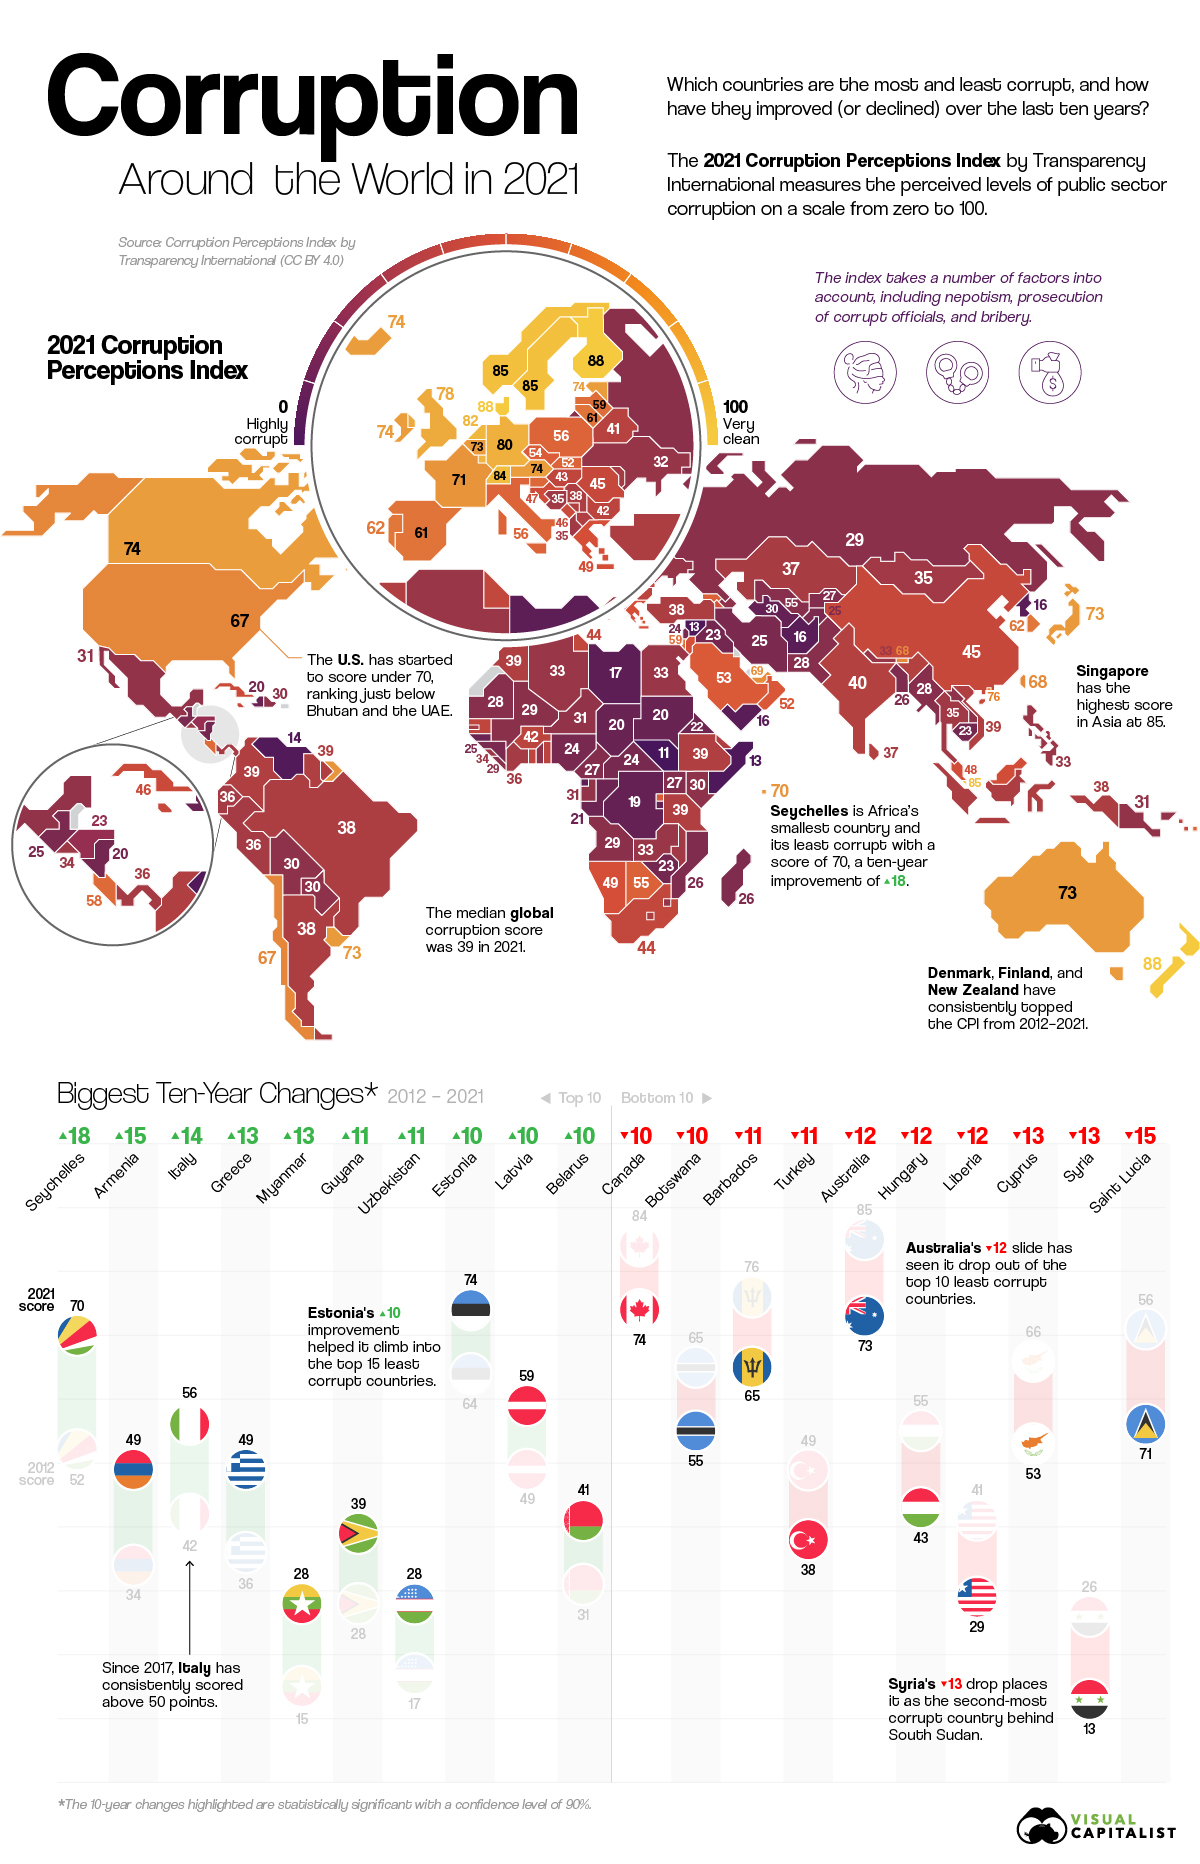
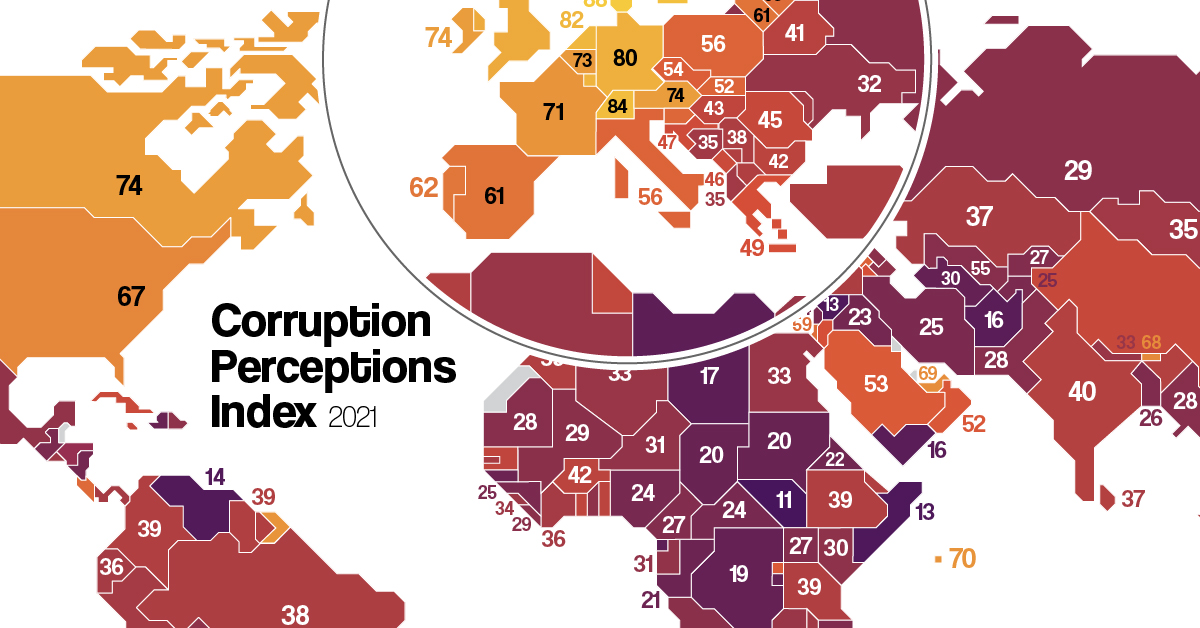
How bad is public sector corruption around the world, and how do different countries compare?
No matter your system of government, the public sector plays a vital role in establishing your economic mobility and political freedoms. Measuring corruption—the abuse of power for private gain—reveals how equal a system truly is.
For more than a decade, the Corruption Perceptions Index (CPI) by Transparency International has been the world’s most widely-used metric for scoring corruption. This infographic uses the 2021 CPI to visualize corruption in countries around the world, and the biggest 10-year changes.
Which Countries are Most (and Least) Corrupt?
How do you measure corruption, which includes behind-the-scenes deals, nepotism, corrupt prosecution, and bribery?
Over the last few decades, the CPI has found success doing so indirectly through perceptions.
By aggregating multiple analyses from country and business experts, the index assigns each country a score on a scale of 0 to 100, where 0 is highly corrupt and 100 is very clean.
Here are the results of the 2021 CPI, with the least corrupt countries at the top:
| Corruption Perception by Country | Score (2021) |
|---|---|
| Denmark | 88 |
| Finland | 88 |
| New Zealand | 88 |
| Norway | 85 |
| Singapore | 85 |
| Sweden | 85 |
| Switzerland | 84 |
| Netherlands | 82 |
| Luxembourg | 81 |
| Germany | 80 |
| UK | 78 |
| Hong Kong | 76 |
| Austria | 74 |
| Canada | 74 |
| Estonia | 74 |
| Iceland | 74 |
| Ireland | 74 |
| Australia | 73 |
| Belgium | 73 |
| Japan | 73 |
| Uruguay | 73 |
| France | 71 |
| Seychelles | 70 |
| UAE | 69 |
| Bhutan | 68 |
| Taiwan | 68 |
| Chile | 67 |
| U.S. | 67 |
| Barbados | 65 |
| Bahamas | 64 |
| Qatar | 63 |
| Portugal | 62 |
| South Korea | 62 |
| Lithuania | 61 |
| Spain | 61 |
| Israel | 59 |
| Latvia | 59 |
| Saint Vincent and the Grenadines | 59 |
| Cabo Verde | 58 |
| Costa Rica | 58 |
| Slovenia | 57 |
| Italy | 56 |
| Poland | 56 |
| Saint Lucia | 56 |
| Botswana | 55 |
| Dominica | 55 |
| Fiji | 55 |
| Georgia | 55 |
| Czechia | 54 |
| Malta | 54 |
| Mauritius | 54 |
| Cyprus | 53 |
| Grenada | 53 |
| Rwanda | 53 |
| Saudi Arabia | 53 |
| Oman | 52 |
| Slovakia | 52 |
| Armenia | 49 |
| Greece | 49 |
| Jordan | 49 |
| Namibia | 49 |
| Malaysia | 48 |
| Croatia | 47 |
| Cuba | 46 |
| Montenegro | 46 |
| China | 45 |
| Romania | 45 |
| Sao Tome and Principe | 45 |
| Vanuatu | 45 |
| Jamaica | 44 |
| South Africa | 44 |
| Tunisia | 44 |
| Ghana | 43 |
| Hungary | 43 |
| Kuwait | 43 |
| Senegal | 43 |
| Solomon Islands | 43 |
| Bahrain | 42 |
| Benin | 42 |
| Bulgaria | 42 |
| Burkina Faso | 42 |
| Belarus | 41 |
| Timor-Leste | 41 |
| Trinidad and Tobago | 41 |
| India | 40 |
| Maldives | 40 |
| Colombia | 39 |
| Ethiopia | 39 |
| Guyana | 39 |
| Kosovo | 39 |
| Morocco | 39 |
| North Macedonia | 39 |
| Suriname | 39 |
| Tanzania | 39 |
| Vietnam | 39 |
| Argentina | 38 |
| Brazil | 38 |
| Indonesia | 38 |
| Lesotho | 38 |
| Serbia | 38 |
| Turkey | 38 |
| Gambia | 37 |
| Kazakhstan | 37 |
| Sri Lanka | 37 |
| Cote d'Ivoire | 36 |
| Ecuador | 36 |
| Moldova | 36 |
| Panama | 36 |
| Peru | 36 |
| Albania | 35 |
| Bosnia and Herzegovina | 35 |
| Malawi | 35 |
| Mongolia | 35 |
| Thailand | 35 |
| El Salvador | 34 |
| Sierra Leone | 34 |
| Algeria | 33 |
| Egypt | 33 |
| Nepal | 33 |
| Philippines | 33 |
| Zambia | 33 |
| Eswatini | 32 |
| Ukraine | 32 |
| Gabon | 31 |
| Mexico | 31 |
| Niger | 31 |
| Papua New Guinea | 31 |
| Azerbaijan | 30 |
| Bolivia | 30 |
| Djibouti | 30 |
| Dominican Republic | 30 |
| Kenya | 30 |
| Laos | 30 |
| Paraguay | 30 |
| Togo | 30 |
| Angola | 29 |
| Liberia | 29 |
| Mali | 29 |
| Russia | 29 |
| Mauritania | 28 |
| Myanmar | 28 |
| Pakistan | 28 |
| Uzbekistan | 28 |
| Cameroon | 27 |
| Kyrgyzstan | 27 |
| Uganda | 27 |
| Bangladesh | 26 |
| Madagascar | 26 |
| Mozambique | 26 |
| Guatemala | 25 |
| Guinea | 25 |
| Iran | 25 |
| Tajikistan | 25 |
| Central African Republic | 24 |
| Lebanon | 24 |
| Nigeria | 24 |
| Cambodia | 23 |
| Honduras | 23 |
| Iraq | 23 |
| Zimbabwe | 23 |
| Eritrea | 22 |
| Congo | 21 |
| Guinea-Bissau | 21 |
| Chad | 20 |
| Comoros | 20 |
| Haiti | 20 |
| Nicaragua | 20 |
| Sudan | 20 |
| Burundi | 19 |
| Democratic Republic of the Congo | 19 |
| Turkmenistan | 19 |
| Equatorial Guinea | 17 |
| Libya | 17 |
| Afghanistan | 16 |
| North Korea | 16 |
| Yemen | 16 |
| Venezuela | 14 |
| Somalia | 13 |
| Syria | 13 |
| South Sudan | 11 |
Ranking at the top of the index with scores of 88 are Nordic countries Denmark and Finland, as well as New Zealand.
They’ve consistently topped the CPI over the last decade, and Europe in general had 14 of the top 20 least corrupt countries. Asia also had many notable entrants, including Singapore (tied for #4), Hong Kong (#12), and Japan (tied for #18).
Comparatively, the Americas only had two countries score in the top 20 least corrupt: Canada (tied for #13) and Uruguay (tied for #18). With a score of 67, the U.S. scored at #28 just behind Bhutan, the UAE, and France.
Scoring towards the bottom of the index were many countries currently and historically going through conflict, primarily located in the Middle East and Africa. They include Afghanistan, Venezuela, Somalia, and South Sudan. The latter country finishes at the very bottom of the list, with a score of just 11.
How Corruption in Countries Has Changed (2012–2021)
Corruption is a constant and moving global problem, so it’s also important to measure which countries have had their images improved (or worsened).
By using CPI scores dating back to 2012, we can examine how country scores have changed over the last decade:
| Change in Corruption by Country | 10-Year Trend (2012-2021) |
|---|---|
| Seychelles | +18 |
| Armenia | +15 |
| Italy | +14 |
| Greece | +13 |
| Myanmar | +13 |
| Guyana | +11 |
| Uzbekistan | +11 |
| Estonia | +10 |
| Latvia | +10 |
| Belarus | +10 |
| Saudi Arabia | +9 |
| Kazakhstan | +9 |
| Laos | +9 |
| Timor-Leste | +8 |
| Vietnam | +8 |
| Afghanistan | +8 |
| North Korea | +8 |
| Taiwan | +7 |
| Lithuania | +7 |
| Senegal | +7 |
| Cote d'Ivoire | +7 |
| Angola | +7 |
| Sudan | +7 |
| South Korea | +6 |
| Slovakia | +6 |
| China | +6 |
| Jamaica | +6 |
| Benin | +6 |
| Ethiopia | +6 |
| Indonesia | +6 |
| Nepal | +6 |
| Ukraine | +6 |
| Papua New Guinea | +6 |
| Austria | +5 |
| Ireland | +5 |
| Bhutan | +5 |
| Czechia | +5 |
| Oman | +5 |
| Montenegro | +5 |
| Kosovo | +5 |
| Paraguay | +5 |
| Iraq | +5 |
| Somalia | +5 |
| United Kingdom | +4 |
| Costa Rica | +4 |
| Burkina Faso | +4 |
| India | +4 |
| Tanzania | +4 |
| Ecuador | +4 |
| Georgia | +3 |
| Sao Tome and Principe | +3 |
| Tunisia | +3 |
| Colombia | +3 |
| Argentina | +3 |
| Gambia | +3 |
| Sierra Leone | +3 |
| Azerbaijan | +3 |
| Kenya | +3 |
| Kyrgyzstan | +3 |
| Tajikistan | +3 |
| Zimbabwe | +3 |
| Trinidad and Tobago | +2 |
| Morocco | +2 |
| Suriname | +2 |
| Albania | +2 |
| Turkmenistan | +2 |
| Luxembourg | +1 |
| Germany | +1 |
| Uruguay | +1 |
| United Arab Emirates | +1 |
| Jordan | +1 |
| Namibia | +1 |
| Croatia | +1 |
| Romania | +1 |
| South Africa | +1 |
| Bulgaria | +1 |
| Egypt | +1 |
| Russia | +1 |
| Pakistan | +1 |
| Cameroon | +1 |
| Guinea | +1 |
| Cambodia | +1 |
| Haiti | +1 |
| Chad | +1 |
| Norway | 0 |
| France | 0 |
| Rwanda | 0 |
| Moldova | 0 |
| Togo | 0 |
| Bangladesh | 0 |
| Burundi | 0 |
| Hong Kong | -1 |
| Japan | -1 |
| Portugal | -1 |
| Israel | -1 |
| Malaysia | -1 |
| Kuwait | -1 |
| Serbia | -1 |
| Mongolia | -1 |
| Algeria | -1 |
| Philippines | -1 |
| Denmark | -2 |
| Finland | -2 |
| New Zealand | -2 |
| Singapore | -2 |
| Switzerland | -2 |
| Netherlands | -2 |
| Belgium | -2 |
| Cabo Verde | -2 |
| Poland | -2 |
| Cuba | -2 |
| Ghana | -2 |
| Panama | -2 |
| Peru | -2 |
| Malawi | -2 |
| Thailand | -2 |
| Niger | -2 |
| Dominican Republic | -2 |
| Uganda | -2 |
| Central African Republic | -2 |
| Democratic Republic of the Congo | -2 |
| Sweden | -3 |
| Saint Vincent and the Grenadines | -3 |
| Dominica | -3 |
| Malta | -3 |
| Mauritius | -3 |
| Sri Lanka | -3 |
| Mexico | -3 |
| Mauritania | -3 |
| Iran | -3 |
| Nigeria | -3 |
| Eritrea | -3 |
| Equatorial Guinea | -3 |
| Spain | -4 |
| Slovenia | -4 |
| North Macedonia | -4 |
| El Salvador | -4 |
| Zambia | -4 |
| Gabon | -4 |
| Bolivia | -4 |
| Guinea-Bissau | -4 |
| Libya | -4 |
| Chile | -5 |
| Qatar | -5 |
| Brazil | -5 |
| Eswatini | -5 |
| Mali | -5 |
| Mozambique | -5 |
| Honduras | -5 |
| Congo | -5 |
| Venezuela | -5 |
| United States of America | -6 |
| Djibouti | -6 |
| Madagascar | -6 |
| Lebanon | -6 |
| Bahamas | -7 |
| Lesotho | -7 |
| Bosnia and Herzegovina | -7 |
| Yemen | -7 |
| Iceland | -8 |
| Guatemala | -8 |
| Comoros | -8 |
| Bahrain | -9 |
| Nicaragua | -9 |
| Canada | -10 |
| Botswana | -10 |
| Barbados | -11 |
| Turkey | -11 |
| Australia | -12 |
| Hungary | -12 |
| Liberia | -12 |
| Cyprus | -13 |
| Syria | -13 |
| Saint Lucia | -15 |
| Fiji | N/A |
| Grenada | N/A |
| Vanuatu | N/A |
| Solomon Islands | N/A |
| Maldives | N/A |
| South Sudan | N/A |
The biggest climber with +18 was Seychelles, Africa’s smallest country and also its least corrupt with a score of 70. Other notable improvements include neighboring countries Estonia, Latvia, and Belarus, with Estonia rising into the top 15 least corrupt countries.
On the opposite side, both Australia (-12) and Canada (-10) have actually fallen out of the top 10 least corrupt countries over the last decade. They’re joined by decreases in Hungary (-12) and Syria (-13), which is now ranked as the world’s second-most corrupt country.
Which countries will rise and fall in corruption perceptions over the next 10 years, and how do your perceptions compare with this list?


Markets
U.S. Debt Interest Payments Reach $1 Trillion
U.S. debt interest payments have surged past the $1 trillion dollar mark, amid high interest rates and an ever-expanding debt burden.


U.S. Debt Interest Payments Reach $1 Trillion
This was originally posted on our Voronoi app. Download the app for free on iOS or Android and discover incredible data-driven charts from a variety of trusted sources.
The cost of paying for America’s national debt crossed the $1 trillion dollar mark in 2023, driven by high interest rates and a record $34 trillion mountain of debt.
Over the last decade, U.S. debt interest payments have more than doubled amid vast government spending during the pandemic crisis. As debt payments continue to soar, the Congressional Budget Office (CBO) reported that debt servicing costs surpassed defense spending for the first time ever this year.
This graphic shows the sharp rise in U.S. debt payments, based on data from the Federal Reserve.
A $1 Trillion Interest Bill, and Growing
Below, we show how U.S. debt interest payments have risen at a faster pace than at another time in modern history:
| Date | Interest Payments | U.S. National Debt |
|---|---|---|
| 2023 | $1.0T | $34.0T |
| 2022 | $830B | $31.4T |
| 2021 | $612B | $29.6T |
| 2020 | $518B | $27.7T |
| 2019 | $564B | $23.2T |
| 2018 | $571B | $22.0T |
| 2017 | $493B | $20.5T |
| 2016 | $460B | $20.0T |
| 2015 | $435B | $18.9T |
| 2014 | $442B | $18.1T |
| 2013 | $425B | $17.2T |
| 2012 | $417B | $16.4T |
| 2011 | $433B | $15.2T |
| 2010 | $400B | $14.0T |
| 2009 | $354B | $12.3T |
| 2008 | $380B | $10.7T |
| 2007 | $414B | $9.2T |
| 2006 | $387B | $8.7T |
| 2005 | $355B | $8.2T |
| 2004 | $318B | $7.6T |
| 2003 | $294B | $7.0T |
| 2002 | $298B | $6.4T |
| 2001 | $318B | $5.9T |
| 2000 | $353B | $5.7T |
| 1999 | $353B | $5.8T |
| 1998 | $360B | $5.6T |
| 1997 | $368B | $5.5T |
| 1996 | $362B | $5.3T |
| 1995 | $357B | $5.0T |
| 1994 | $334B | $4.8T |
| 1993 | $311B | $4.5T |
| 1992 | $306B | $4.2T |
| 1991 | $308B | $3.8T |
| 1990 | $298B | $3.4T |
| 1989 | $275B | $3.0T |
| 1988 | $254B | $2.7T |
| 1987 | $240B | $2.4T |
| 1986 | $225B | $2.2T |
| 1985 | $219B | $1.9T |
| 1984 | $205B | $1.7T |
| 1983 | $176B | $1.4T |
| 1982 | $157B | $1.2T |
| 1981 | $142B | $1.0T |
| 1980 | $113B | $930.2B |
| 1979 | $96B | $845.1B |
| 1978 | $84B | $789.2B |
| 1977 | $69B | $718.9B |
| 1976 | $61B | $653.5B |
| 1975 | $55B | $576.6B |
| 1974 | $50B | $492.7B |
| 1973 | $45B | $469.1B |
| 1972 | $39B | $448.5B |
| 1971 | $36B | $424.1B |
| 1970 | $35B | $389.2B |
| 1969 | $30B | $368.2B |
| 1968 | $25B | $358.0B |
| 1967 | $23B | $344.7B |
| 1966 | $21B | $329.3B |
Interest payments represent seasonally adjusted annual rate at the end of Q4.
At current rates, the U.S. national debt is growing by a remarkable $1 trillion about every 100 days, equal to roughly $3.6 trillion per year.
As the national debt has ballooned, debt payments even exceeded Medicaid outlays in 2023—one of the government’s largest expenditures. On average, the U.S. spent more than $2 billion per day on interest costs last year. Going further, the U.S. government is projected to spend a historic $12.4 trillion on interest payments over the next decade, averaging about $37,100 per American.
Exacerbating matters is that the U.S. is running a steep deficit, which stood at $1.1 trillion for the first six months of fiscal 2024. This has accelerated due to the 43% increase in debt servicing costs along with a $31 billion dollar increase in defense spending from a year earlier. Additionally, a $30 billion increase in funding for the Federal Deposit Insurance Corporation in light of the regional banking crisis last year was a major contributor to the deficit increase.
Overall, the CBO forecasts that roughly 75% of the federal deficit’s increase will be due to interest costs by 2034.

-

 Real Estate2 weeks ago
Visualizing America’s Shortage of Affordable Homes
-

 Technology1 week ago
Ranked: Semiconductor Companies by Industry Revenue Share
-

 Money1 week ago
Which States Have the Highest Minimum Wage in America?
-

 Real Estate1 week ago
Ranked: The Most Valuable Housing Markets in America
-

 Business2 weeks ago
Charted: Big Four Market Share by S&P 500 Audits
-

 AI2 weeks ago
The Stock Performance of U.S. Chipmakers So Far in 2024
-

 Misc2 weeks ago
Almost Every EV Stock is Down After Q1 2024
-

 Money2 weeks ago
Where Does One U.S. Tax Dollar Go?