Markets
Mapped: 2023 Inflation Forecasts by Country
Mapped: 2023 Inflation Forecasts by Country
This was originally posted on Advisor Channel. Sign up to the free mailing list to get beautiful visualizations on financial markets that help advisors and their clients.
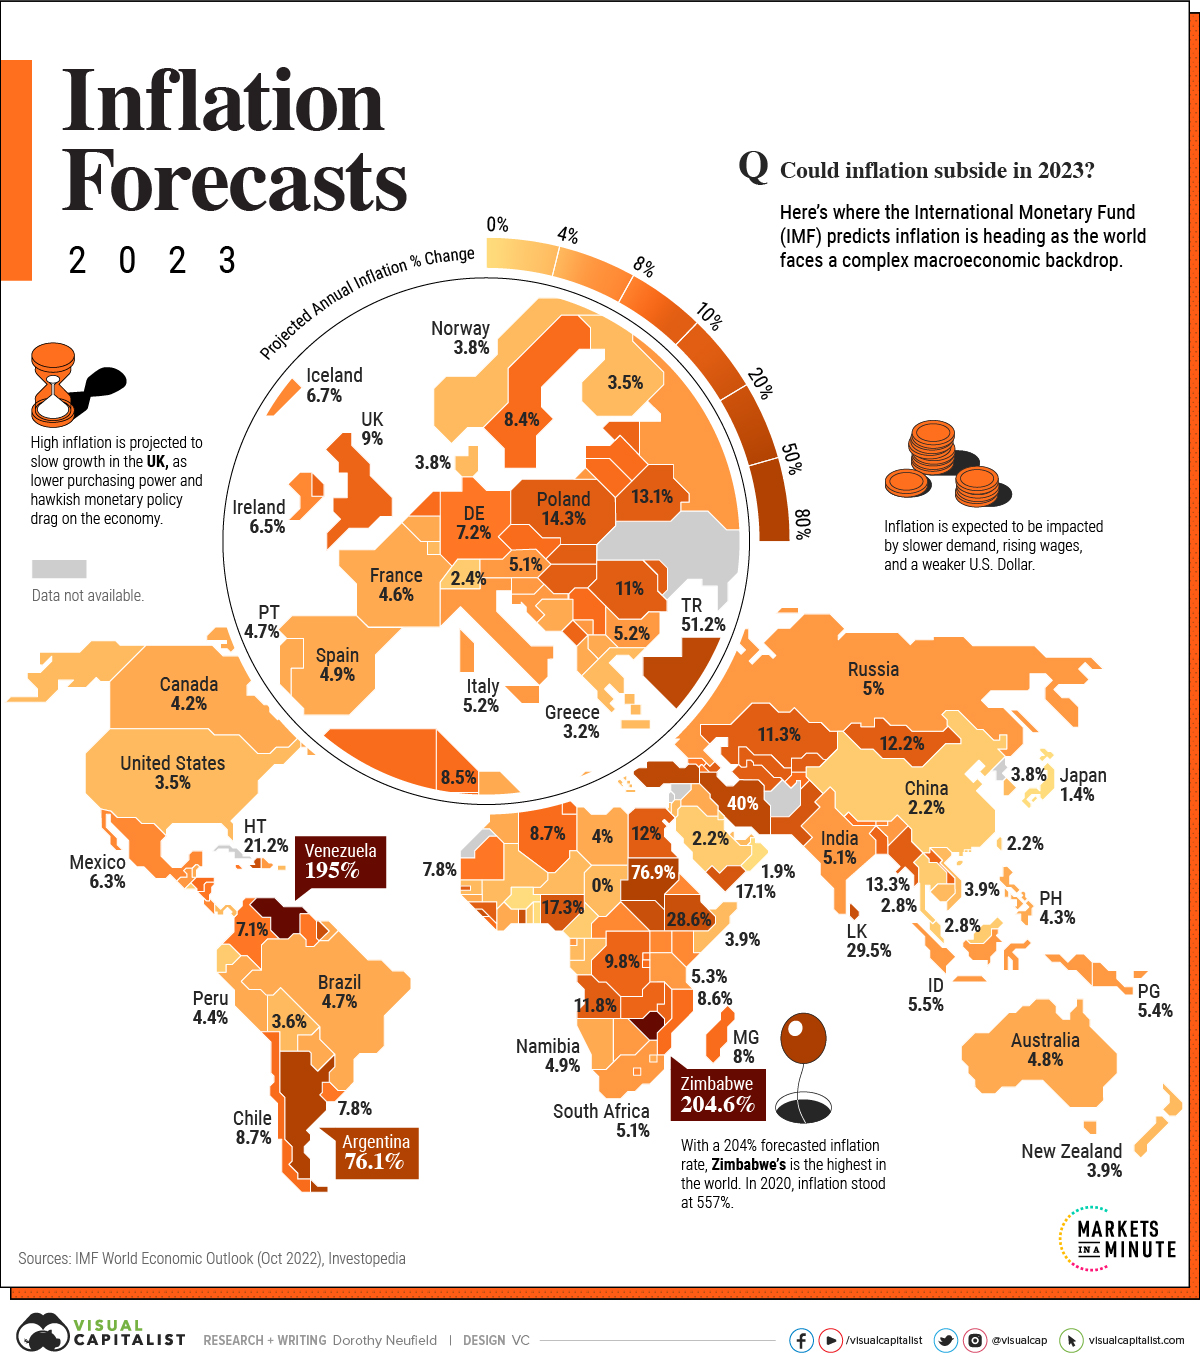
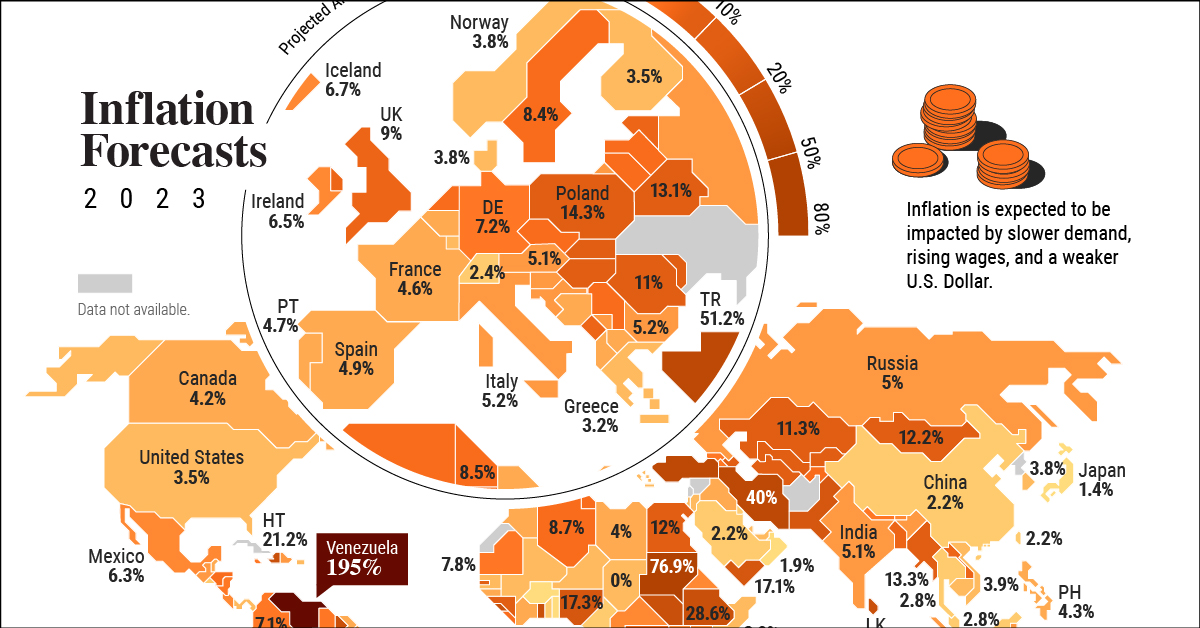
Inflation surged on a global scale in 2022, hitting record-level highs in many countries. Could it finally subside in 2023?
In the above infographic, we look to answer that question using the World Economic Outlook report by the International Monetary Fund (IMF).
Not Yet Out of the Woods
While the IMF predicts that global inflation peaked in late 2022, rates in 2023 are expected to remain higher than usual in many parts of the world. Following the 8.8% global inflation rate in 2022, the IMF forecasts a 6.6% rate for 2023 and 4.3% rate for 2024 based on their most recent January 2023 update.
For the optimists, the good news is that the double-digit inflation that characterized nearly half the world in 2022 is expected to be less prevalent this year. For the pessimists, on the other hand, looking at countries like Zimbabwe, Venezuela, Turkey, and Poland may suggest that we are far from out of the woods on a global scale.
Here are the countries with the highest forecasted inflation rates in 2023.
| Country / Region | Projected Annual Inflation % Change 2023 |
|---|---|
| 🇿🇼 Zimbabwe | 204.6% |
| 🇻🇪 Venezuela | 195.0% |
| 🇸🇩 Sudan | 76.9% |
| 🇦🇷 Argentina | 76.1% |
| 🇹🇷 Turkiye | 51.2% |
| 🇮🇷 Islamic Republic of Iran | 40.0% |
| 🇱🇰 Sri Lanka | 29.5% |
| 🇪🇹 Ethiopia | 28.6% |
| 🇸🇷 Suriname | 27.2% |
| 🇸🇱 Sierra Leone | 26.8% |
| 🇸🇸 South Sudan | 21.7% |
| 🇭🇹 Haiti | 21.2% |
| 🇬🇭 Ghana | 20.9% |
| 🇵🇰 Pakistan | 19.9% |
| 🇳🇬 Nigeria | 17.3% |
| 🇾🇪 Yemen | 17.1% |
| 🇲🇼 Malawi | 16.5% |
| 🇵🇱 Poland | 14.3% |
| 🇲🇩 Moldova | 13.8% |
| 🇲🇲 Myanmar | 13.3% |
| 🇭🇺 Hungary | 13.3% |
| 🇧🇾 Belarus | 13.1% |
| 🇰🇬 Kyrgyz Republic | 12.4% |
| 🇬🇳 Guinea | 12.2% |
| 🇲🇳 Mongolia | 12.2% |
| 🇪🇬 Egypt | 12.0% |
| 🇦🇴 Angola | 11.8% |
| 🇰🇿 Kazakhstan | 11.3% |
| 🇸🇹 São Tomé and Príncipe | 11.2% |
| 🇷🇴 Romania | 11.0% |
| 🇺🇿 Uzbekistan | 10.8% |
| 🇦🇿 Azerbaijan | 10.8% |
| 🇹🇲 Turkmenistan | 10.5% |
| 🇸🇰 Slovak Republic | 10.1% |
| 🇨🇩 Democratic Republic of the Congo | 9.8% |
| 🇿🇲 Zambia | 9.6% |
| 🇪🇪 Estonia | 9.5% |
| 🇲🇪 Montenegro | 9.2% |
| 🇧🇩 Bangladesh | 9.1% |
| 🇬🇧 United Kingdom | 9.0% |
While the above countries fight to sustain their purchasing power, some parts of the world are expected to continue faring exceptionally well against the backdrop of a widespread cost-of-living crisis. Many Asian countries, notably Japan, Taiwan, and China, are all predicted to see inflation lower than 3% in the upcoming year.
When it comes to low inflation, Japan in particular stands out. With strict price controls, negative interest rates, and an aging population, the country is expected to see an inflation rate of just 1.4% in 2023.
Inflation Drivers
While rising food and energy prices accounted for much of the inflation we saw in 2022, the IMF’s World Economic Outlook highlights that core inflation, which excludes food, energy, transport and housing prices, is now also a major driving factor in high inflation rates around the world.
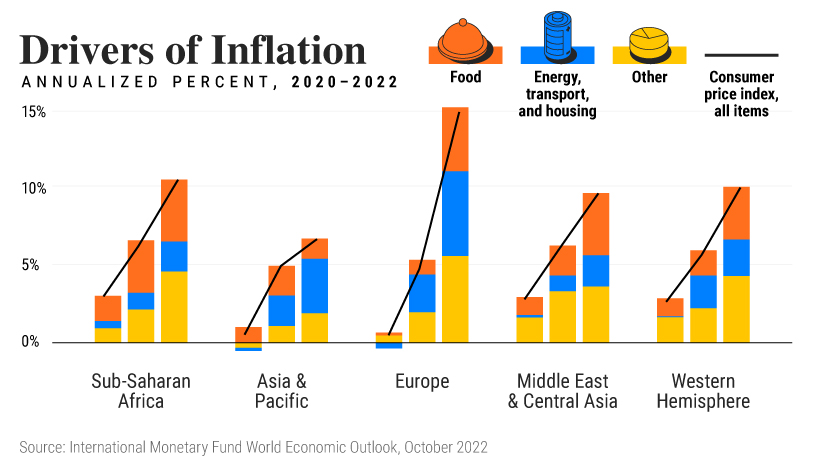
What makes up core inflation exactly? In this case, it would include things like supply chain cost pressures and the effects of high energy prices slowly trickling down into numerous industries and trends in the labor market, such as the availability of jobs and rising wages. As these macroeconomic factors play out throughout 2023, each can have an effect on inflation.
The Russia-Ukraine conflict and the lingering effects of the COVID-19 pandemic are also still at play in this year’s inflation forecasts. While the latter mainly played out in China in 2022, the possible resurgence of new variants continues to threaten economic recovery worldwide, and the war persists in leaving a mark internationally.
The confluence of macroeconomic factors currently at play is unlike what we’ve seen in a long time. Though the expertise of forecasters can give us a general understanding, how they will actually play out is for us to wait and see.


Markets
U.S. Debt Interest Payments Reach $1 Trillion
U.S. debt interest payments have surged past the $1 trillion dollar mark, amid high interest rates and an ever-expanding debt burden.


U.S. Debt Interest Payments Reach $1 Trillion
This was originally posted on our Voronoi app. Download the app for free on iOS or Android and discover incredible data-driven charts from a variety of trusted sources.
The cost of paying for America’s national debt crossed the $1 trillion dollar mark in 2023, driven by high interest rates and a record $34 trillion mountain of debt.
Over the last decade, U.S. debt interest payments have more than doubled amid vast government spending during the pandemic crisis. As debt payments continue to soar, the Congressional Budget Office (CBO) reported that debt servicing costs surpassed defense spending for the first time ever this year.
This graphic shows the sharp rise in U.S. debt payments, based on data from the Federal Reserve.
A $1 Trillion Interest Bill, and Growing
Below, we show how U.S. debt interest payments have risen at a faster pace than at another time in modern history:
| Date | Interest Payments | U.S. National Debt |
|---|---|---|
| 2023 | $1.0T | $34.0T |
| 2022 | $830B | $31.4T |
| 2021 | $612B | $29.6T |
| 2020 | $518B | $27.7T |
| 2019 | $564B | $23.2T |
| 2018 | $571B | $22.0T |
| 2017 | $493B | $20.5T |
| 2016 | $460B | $20.0T |
| 2015 | $435B | $18.9T |
| 2014 | $442B | $18.1T |
| 2013 | $425B | $17.2T |
| 2012 | $417B | $16.4T |
| 2011 | $433B | $15.2T |
| 2010 | $400B | $14.0T |
| 2009 | $354B | $12.3T |
| 2008 | $380B | $10.7T |
| 2007 | $414B | $9.2T |
| 2006 | $387B | $8.7T |
| 2005 | $355B | $8.2T |
| 2004 | $318B | $7.6T |
| 2003 | $294B | $7.0T |
| 2002 | $298B | $6.4T |
| 2001 | $318B | $5.9T |
| 2000 | $353B | $5.7T |
| 1999 | $353B | $5.8T |
| 1998 | $360B | $5.6T |
| 1997 | $368B | $5.5T |
| 1996 | $362B | $5.3T |
| 1995 | $357B | $5.0T |
| 1994 | $334B | $4.8T |
| 1993 | $311B | $4.5T |
| 1992 | $306B | $4.2T |
| 1991 | $308B | $3.8T |
| 1990 | $298B | $3.4T |
| 1989 | $275B | $3.0T |
| 1988 | $254B | $2.7T |
| 1987 | $240B | $2.4T |
| 1986 | $225B | $2.2T |
| 1985 | $219B | $1.9T |
| 1984 | $205B | $1.7T |
| 1983 | $176B | $1.4T |
| 1982 | $157B | $1.2T |
| 1981 | $142B | $1.0T |
| 1980 | $113B | $930.2B |
| 1979 | $96B | $845.1B |
| 1978 | $84B | $789.2B |
| 1977 | $69B | $718.9B |
| 1976 | $61B | $653.5B |
| 1975 | $55B | $576.6B |
| 1974 | $50B | $492.7B |
| 1973 | $45B | $469.1B |
| 1972 | $39B | $448.5B |
| 1971 | $36B | $424.1B |
| 1970 | $35B | $389.2B |
| 1969 | $30B | $368.2B |
| 1968 | $25B | $358.0B |
| 1967 | $23B | $344.7B |
| 1966 | $21B | $329.3B |
Interest payments represent seasonally adjusted annual rate at the end of Q4.
At current rates, the U.S. national debt is growing by a remarkable $1 trillion about every 100 days, equal to roughly $3.6 trillion per year.
As the national debt has ballooned, debt payments even exceeded Medicaid outlays in 2023—one of the government’s largest expenditures. On average, the U.S. spent more than $2 billion per day on interest costs last year. Going further, the U.S. government is projected to spend a historic $12.4 trillion on interest payments over the next decade, averaging about $37,100 per American.
Exacerbating matters is that the U.S. is running a steep deficit, which stood at $1.1 trillion for the first six months of fiscal 2024. This has accelerated due to the 43% increase in debt servicing costs along with a $31 billion dollar increase in defense spending from a year earlier. Additionally, a $30 billion increase in funding for the Federal Deposit Insurance Corporation in light of the regional banking crisis last year was a major contributor to the deficit increase.
Overall, the CBO forecasts that roughly 75% of the federal deficit’s increase will be due to interest costs by 2034.

-

 Green1 week ago
Ranked: The Countries With the Most Air Pollution in 2023
-

 Automotive2 weeks ago
Almost Every EV Stock is Down After Q1 2024
-

 AI2 weeks ago
The Stock Performance of U.S. Chipmakers So Far in 2024
-

 Markets2 weeks ago
Charted: Big Four Market Share by S&P 500 Audits
-

 Real Estate2 weeks ago
Ranked: The Most Valuable Housing Markets in America
-

 Money2 weeks ago
Which States Have the Highest Minimum Wage in America?
-

 AI2 weeks ago
Ranked: Semiconductor Companies by Industry Revenue Share
-

 Travel2 weeks ago
Ranked: The World’s Top Flight Routes, by Revenue