Money
Visualizing the Wealth of Nations
Visualizing the Wealth of Nations
Just as there exists a longstanding inequality in the distribution of household wealth, so exists a considerable differential in the amount of wealth held by countries on the international stage.
Simply put, some nations are “haves”, while many others are “have-nots”.
“Wherever there is great property, there is great inequality.”
– Adam Smith, The Wealth of Nations
Ranking Riches
We previously showed you how the ranking of the richest countries in the world has changed over the course of the last 10 years (2008-2018).
Today’s chart keys on a slightly different question.
What are the wealthiest nations today, both in absolute and per capita terms, and how is this list projected to change over the next decade? Let’s see how the wealth of nations stack up.
Private Wealth: Now and in the Future
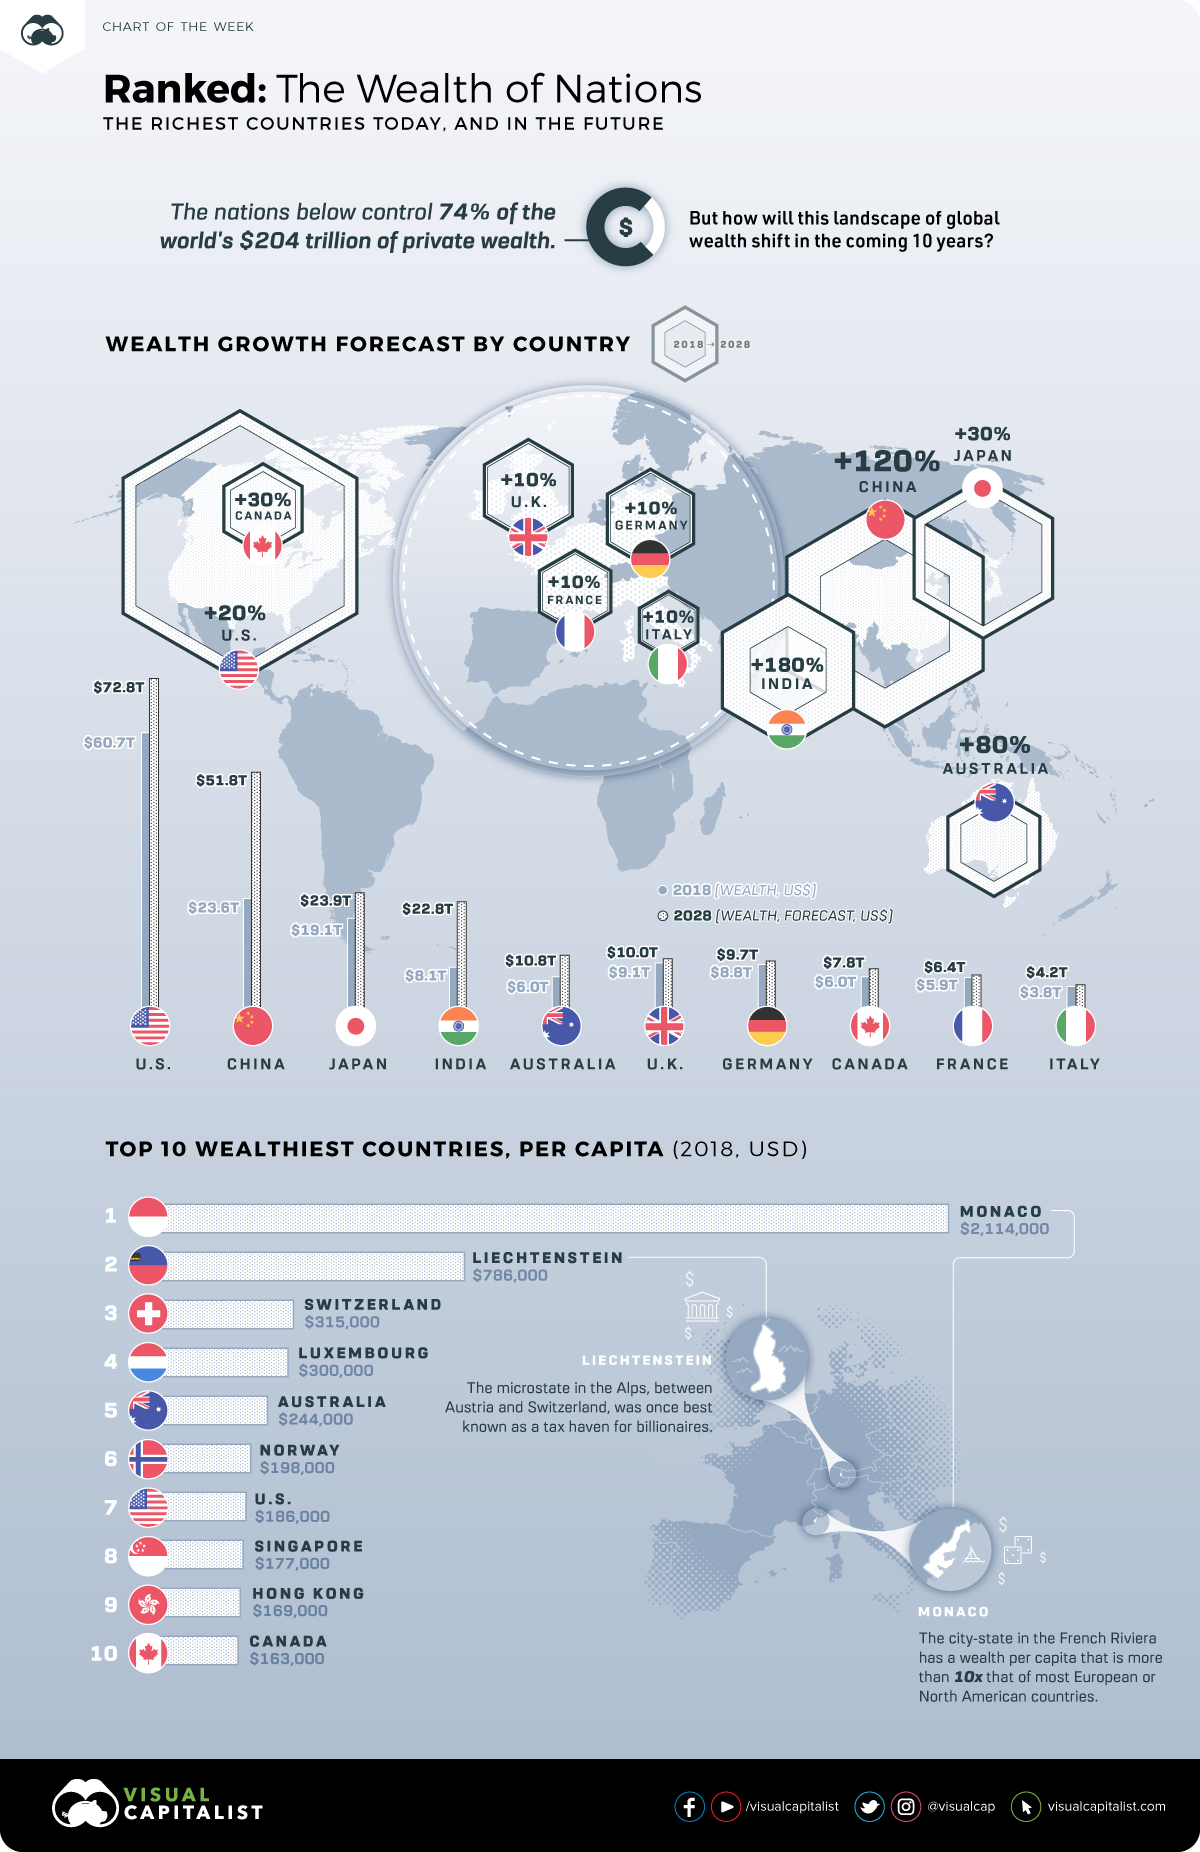
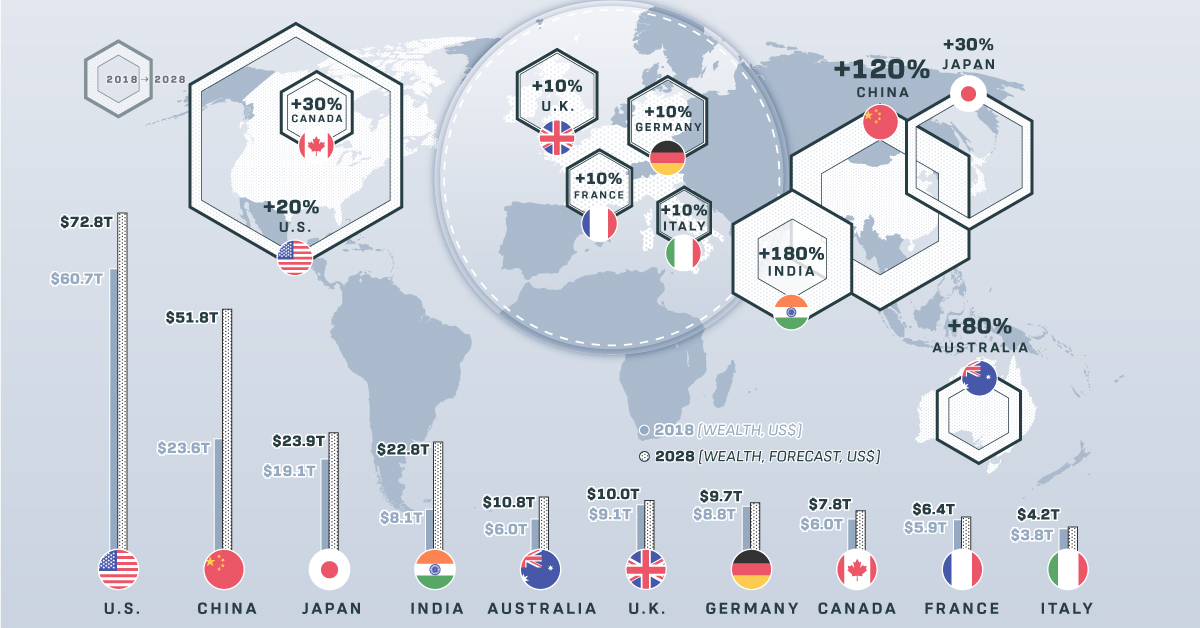
Using data from the Global Wealth Migration Review, here are the 10 wealthiest nations both now and as forecasted in 2028.
| Rank | Country | Wealth (2018) | Wealth (2028F) | Approx. Growth |
|---|---|---|---|---|
| #1 | 🇺🇸 United States | $60.7 trillion | $72.8 trillion | 20% |
| #2 | 🇨🇳 China | $23.6 trillion | $51.8 trillion | 120% |
| #3 | 🇯🇵 Japan | $19.1 trillion | $24.9 trillion | 30% |
| #4 | 🇮🇳 India | $8.1 trillion | $22.8 trillion | 180% |
| #5 | 🇦🇺 Australia | $6.0 trillion | $10.8 trillion | 80% |
| #6 | 🇬🇧 United Kingdom | $9.1 trillion | $10.0 trillion | 10% |
| #7 | 🇩🇪 Germany | $8.8 trillion | $9.7 trillion | 10% |
| #8 | 🇨🇦 Canada | $6.0 trillion | $7.8 trillion | 30% |
| #9 | 🇫🇷 France | $5.9 trillion | $6.4 trillion | 10% |
| #10 | 🇮🇹 Italy | $3.8 trillion | $4.2 trillion | 10% |
It’s worth noting that these figures are meant to represent wealth, which is defined as the total amount of private wealth held by individuals in each country. It includes assets like property, cash, equities, and business interests, minus any liabilities.
China has been the best performing wealth market in the last decade, and these projections show the country as continuing on that track. In fact, both China and India are expected to see triple-digit growth in private wealth between now and 2028.
As far as developed countries go, it’s not surprising that growth rates are much more modest. In Europe, countries like Great Britain, Germany, France, and Italy are only expected to add 10% to private wealth in 10 years, while Canada (30%) and the U.S. (20%) do marginally better.
One notable exception here is Australia, which is expected to add 80% to private wealth over the timeframe – and it will leapfrog both Germany and the U.K. in the rankings in the process.
Wealth per Capita
Here’s a look at the wealth of nations in a different way, this time with numbers adjusted on a per capita basis.
| Rank | Country | Est. Population | Wealth per capita (2018) |
|---|---|---|---|
| #1 | 🇲🇨 Monaco | 38,695 | $2,114,000 |
| #2 | 🇱🇮 Liechtenstein | 37,810 | $786,000 |
| #3 | 🇨🇭 Switzerland | 8,420,000 | $315,000 |
| #4 | 🇱🇺 Luxembourg | 590,667 | $300,000 |
| #5 | 🇦🇺 Australia | 24,600,000 | $244,000 |
| #6 | 🇳🇴 Norway | 5,258,000 | $198,000 |
| #7 | 🇺🇸 United States | 327,200,000 | $186,000 |
| #8 | 🇸🇬 Singapore | 5,612,000 | $177,000 |
| #9 | 🇭🇰 Hong Kong | 7,392,000 | $169,000 |
| #10 | 🇨🇦 Canada | 36,540,000 | $163,000 |
When using per capita numbers, it’s absolutely no contest.
Monaco, the city-state on the French Riviera, is a money magnet with $2.1 million of private wealth per citizen. This means the average Monacan is at least 10 times richer than the average North American or European.
Liechtenstein, a microstate that sits in the Alps between Switzerland and Austria, also has a high average wealth of $786,000 per person. Like Monaco, its population is well under 50,000 people.
Finally, it’s worth mentioning that three countries on the per capita list also made the overall list. Put another way, the countries of Australia, Canada, and the United States can all claim to be among the wealthiest of nations in both absolute and per capita terms.


Demographics
The Smallest Gender Wage Gaps in OECD Countries
Which OECD countries have the smallest gender wage gaps? We look at the 10 countries with gaps lower than the average.


The Smallest Gender Pay Gaps in OECD Countries
This was originally posted on our Voronoi app. Download the app for free on iOS or Android and discover incredible data-driven charts from a variety of trusted sources.
Among the 38 member countries in the Organization for Economic Cooperation and Development (OECD), several have made significant strides in addressing income inequality between men and women.
In this graphic we’ve ranked the OECD countries with the 10 smallest gender pay gaps, using the latest data from the OECD for 2022.
The gender pay gap is calculated as the difference between median full-time earnings for men and women divided by the median full-time earnings of men.
Which Countries Have the Smallest Gender Pay Gaps?
Luxembourg’s gender pay gap is the lowest among OECD members at only 0.4%—well below the OECD average of 11.6%.
| Rank | Country | Percentage Difference in Men's & Women's Full-time Earnings |
|---|---|---|
| 1 | 🇱🇺 Luxembourg | 0.4% |
| 2 | 🇧🇪 Belgium | 1.1% |
| 3 | 🇨🇷 Costa Rica | 1.4% |
| 4 | 🇨🇴 Colombia | 1.9% |
| 5 | 🇮🇪 Ireland | 2.0% |
| 6 | 🇭🇷 Croatia | 3.2% |
| 7 | 🇮🇹 Italy | 3.3% |
| 8 | 🇳🇴 Norway | 4.5% |
| 9 | 🇩🇰 Denmark | 5.8% |
| 10 | 🇵🇹 Portugal | 6.1% |
| OECD Average | 11.6% |
Notably, eight of the top 10 countries with the smallest gender pay gaps are located in Europe, as labor equality laws designed to target gender differences have begun to pay off.
The two other countries that made the list were Costa Rica (1.4%) and Colombia (1.9%), which came in third and fourth place, respectively.
How Did Luxembourg (Nearly) Eliminate its Gender Wage Gap?
Luxembourg’s virtually-non-existent gender wage gap in 2020 can be traced back to its diligent efforts to prioritize equal pay. Since 2016, firms that have not complied with the Labor Code’s equal pay laws have been subjected to penalizing fines ranging from €251 to €25,000.
Higher female education rates also contribute to the diminishing pay gap, with Luxembourg tied for first in the educational attainment rankings of the World Economic Forum’s Global Gender Gap Index Report for 2023.
See More Graphics about Demographics and Money
While these 10 countries are well below the OECD’s average gender pay gap of 11.6%, many OECD member countries including the U.S. are significantly above the average. To see the full list of the top 10 OECD countries with the largest gender pay gaps, check out this visualization.

-

 Mining2 weeks ago
Charted: The Value Gap Between the Gold Price and Gold Miners
-

 Real Estate1 week ago
Ranked: The Most Valuable Housing Markets in America
-

 Business1 week ago
Charted: Big Four Market Share by S&P 500 Audits
-

 AI1 week ago
The Stock Performance of U.S. Chipmakers So Far in 2024
-

 Misc1 week ago
Almost Every EV Stock is Down After Q1 2024
-

 Money2 weeks ago
Where Does One U.S. Tax Dollar Go?
-

 Green2 weeks ago
Ranked: Top Countries by Total Forest Loss Since 2001
-

 Real Estate2 weeks ago
Visualizing America’s Shortage of Affordable Homes