Misc
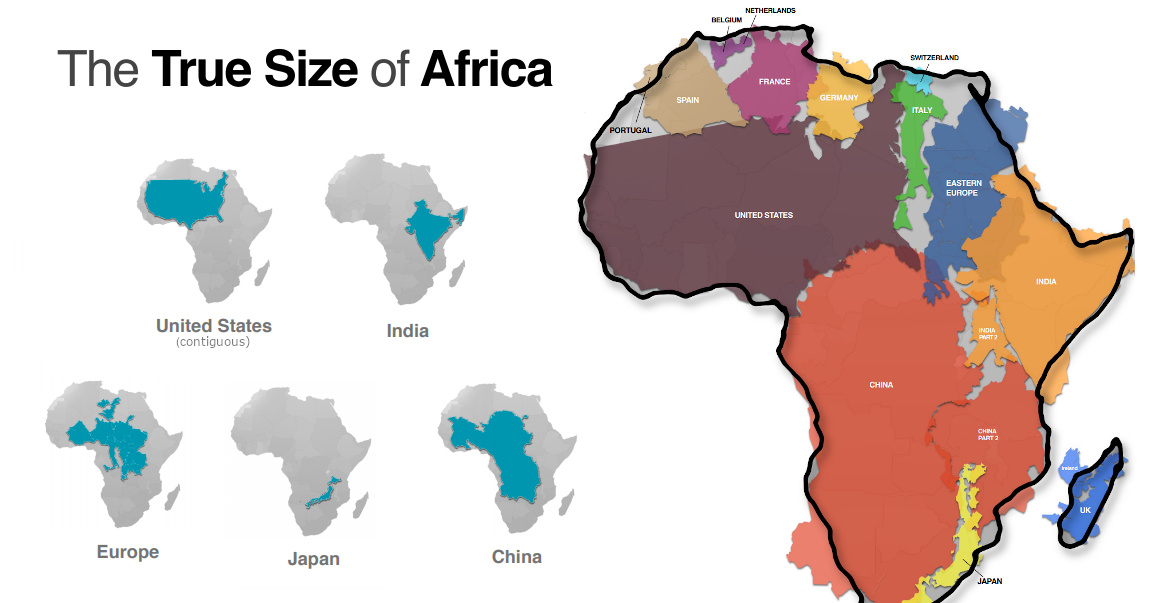
Mapped: Visualizing the True Size of Africa
Mapped: The True Size of Africa
Take a look at any map, and it’s clear that the African continent is a big place.
However, despite the common perception that Africa is a large landmass, it’s still one that is vastly underestimated by most casual map viewers.
The reason for this is that the familiar Mercator map projection tends to distort our geographical view of the world in a crucial way — one that often leads to misconceptions about the relative sizes of both countries and continents.
A Geographical Jigsaw
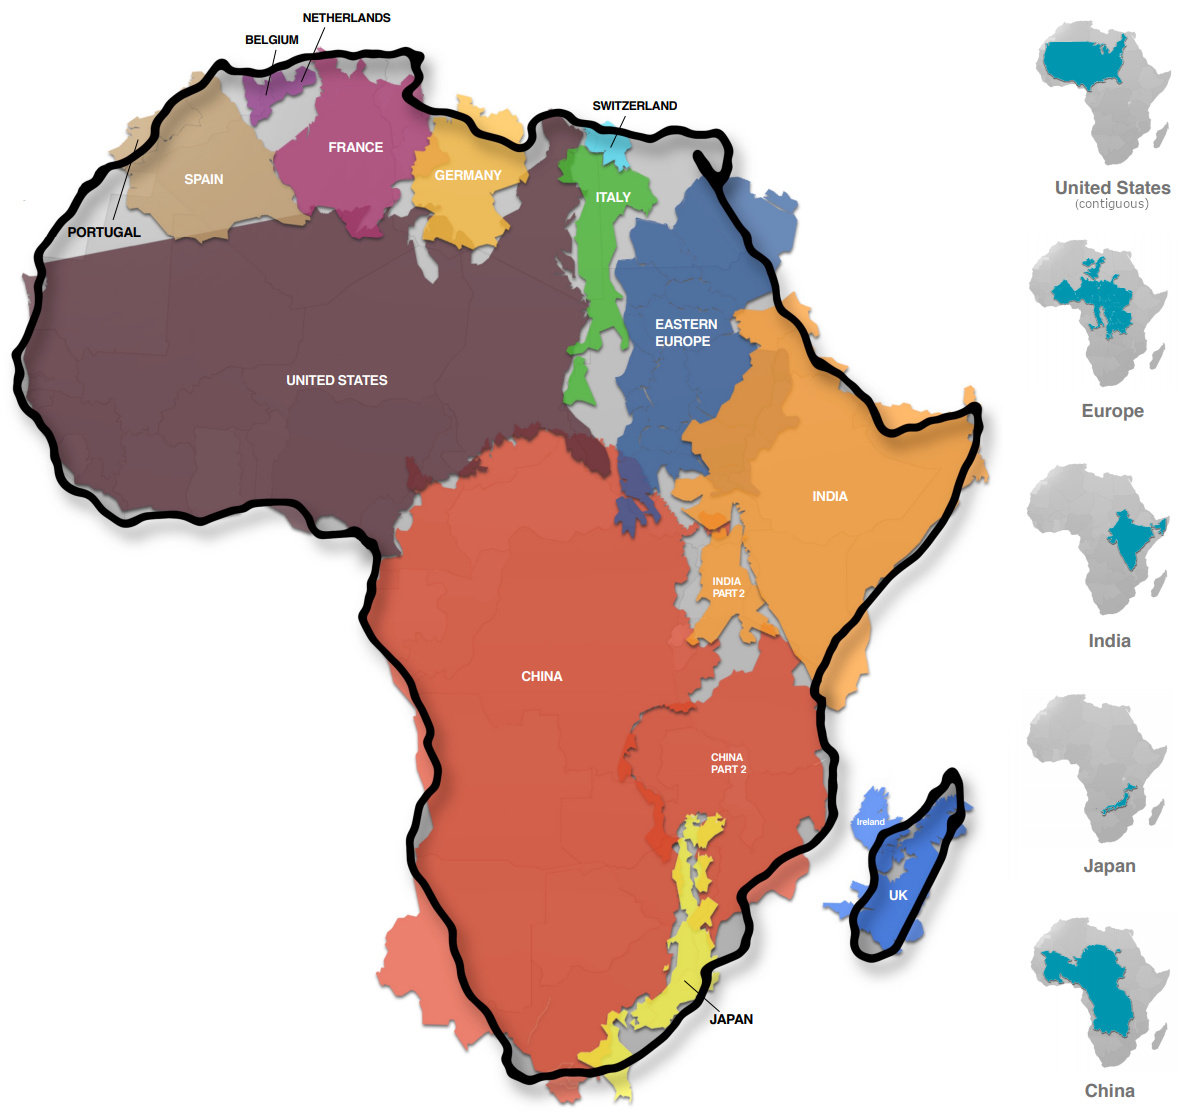
Today’s infographic comes from Kai Krause and it shows the true size of Africa, as revealed by the borders of the countries that can fit within the continent’s shape.
The African continent has a land area of 30.37 million sq km (11.7 million sq mi) — enough to fit in the U.S., China, India, Japan, Mexico, and many European nations, combined.
| Country | Land Area (sq. km) | Land Area (sq. mi) | % of Africa |
|---|---|---|---|
| 🇺🇸 United States | 9.83 million | 3.80 million | 32.4% |
| 🇨🇳 China | 9.60 million | 3.71 million | 31.6% |
| 🇮🇳 India | 3.29 million | 1.27 million | 10.8% |
| 🇲🇽 Mexico | 1.96 million | 0.76 million | 6.5% |
| 🇵🇪 Peru | 1.29 million | 0.50 million | 4.2% |
| 🇫🇷 France | 0.64 million | 0.25 million | 2.1% |
| 🇪🇸 Spain | 0.51 million | 0.20 million | 1.7% |
| 🇵🇬 Papua New Guinea | 0.46 million | 0.18 million | 1.5% |
| 🇸🇪 Sweden | 0.45 million | 0.17 million | 1.5% |
| 🇯🇵 Japan | 0.38 million | 0.15 million | 1.3% |
| 🇩🇪 Germany | 0.36 million | 0.14 million | 1.2% |
| 🇳🇴 Norway | 0.32 million | 0.13 million | 1.1% |
| 🇮🇹 Italy | 0.30 million | 0.12 million | 1.0% |
| 🇳🇿 New Zealand | 0.27 million | 0.10 million | 0.9% |
| 🇬🇧 United Kingdom | 0.24 million | 0.09 million | 0.8% |
| 🇳🇵 Nepal | 0.15 million | 0.06 million | 0.5% |
| 🇧🇩 Bangladesh | 0.15 million | 0.06 million | 0.5% |
| 🇬🇷 Greece | 0.13 million | 0.05 million | 0.4% |
| Total | 30.33 million sq. km | 11.71 million sq. mi | 99.9% |
You could add together all of the landmasses above and they would not equate to the geographical footprint of Africa, which itself is home to 54 countries and 1.2 billion people.
Editor’s note: The above table is slightly different from the countries shown in the visualization, which focuses more on fitting recognizable country shapes into the geographical shape of Africa.
Why the Misconception?
Interestingly, the problem with maps is not that Africa is sized incorrectly.
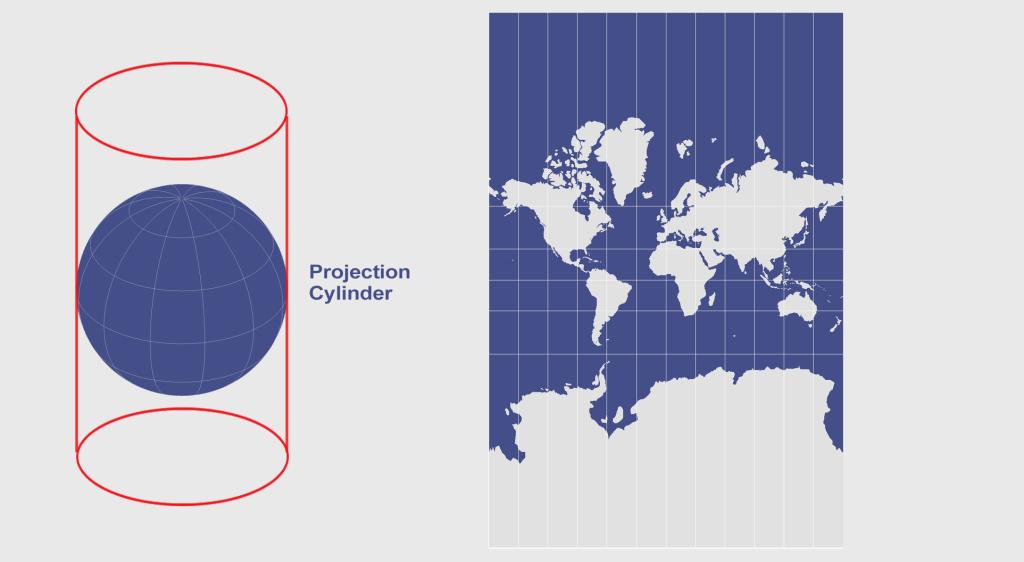
Using the animation below, you’ll see that Africa is actually the most accurately sized continent using the common Mercator map projection:
The Mercator projection attempts to place the spherical shape of the world onto a cylinder, causing areas closest to the poles to be “stretched”.
Africa, which straddles the Equator, barely changes in size — meanwhile, the countries furthest from the Equator become inflated from their true sizes on this type of map.
For those of us living in Western countries, this is an interesting dilemma to consider.
This means that the sizes of European and North American countries are distorted, giving us an inaccurate mental “measuring stick” for judging the relative sizes of other countries.
This has implications not only for Africa, but for the whole Southern Hemisphere: South America, India, the Middle East, and even Australia are “bigger” than they may initially appear on a map.


Maps
The Largest Earthquakes in the New York Area (1970-2024)
The earthquake that shook buildings across New York in April 2024 was the third-largest quake in the Northeast U.S. over the past 50 years.


The Largest Earthquakes in the New York Area
This was originally posted on our Voronoi app. Download the app for free on Apple or Android and discover incredible data-driven charts from a variety of trusted sources.
The 4.8 magnitude earthquake that shook buildings across New York on Friday, April 5th, 2024 was the third-largest quake in the U.S. Northeast area over the past 50 years.
In this map, we illustrate earthquakes with a magnitude of 4.0 or greater recorded in the Northeastern U.S. since 1970, according to the United States Geological Survey (USGS).
Shallow Quakes and Older Buildings
The earthquake that struck the U.S. Northeast in April 2024 was felt by millions of people from Washington, D.C., to north of Boston. It even caused a full ground stop at Newark Airport.
The quake, occurring just 5 km beneath the Earth’s surface, was considered shallow, which is what contributed to more intense shaking at the surface.
According to the USGS, rocks in the eastern U.S. are significantly older, denser, and harder than those on the western side, compressed by time. This makes them more efficient conduits for seismic energy. Additionally, buildings in the Northeast tend to be older and may not adhere to the latest earthquake codes.
Despite disrupting work and school life, the earthquake was considered minor, according to the Michigan Technological University magnitude scale:
| Magnitude | Earthquake Effects | Estimated Number Each Year |
|---|---|---|
| 2.5 or less | Usually not felt, but can be recorded by seismograph. | Millions |
| 2.5 to 5.4 | Often felt, but only causes minor damage. | 500,000 |
| 5.5 to 6.0 | Slight damage to buildings and other structures. | 350 |
| 6.1 to 6.9 | May cause a lot of damage in very populated areas. | 100 |
| 7.0 to 7.9 | Major earthquake. Serious damage. | 10-15 |
| 8.0 or greater | Great earthquake. Can totally destroy communities near the epicenter. | One every year or two |
The largest earthquake felt in the area over the past 50 years was a 5.3 magnitude quake that occurred in Au Sable Forks, New York, in 2002. It damaged houses and cracked roads in a remote corner of the Adirondack Mountains, but caused no injuries.
| Date | Magnitude | Location | State |
|---|---|---|---|
| April 20, 2002 | 5.3 | Au Sable Forks | New York |
| October 7, 1983 | 5.1 | Newcomb | New York |
| April 5, 2024 | 4.8 | Whitehouse Station | New Jersey |
| October 16, 2012 | 4.7 | Hollis Center | Maine |
| January 16, 1994 | 4.6 | Sinking Spring | Pennsylvania |
| January 19, 1982 | 4.5 | Sanbornton | New Hampshire |
| September 25, 1998 | 4.5 | Adamsville | Pennsylvania |
| June 9, 1975 | 4.2 | Altona | New York |
| May 29, 1983 | 4.2 | Peru | Maine |
| April 23, 1984 | 4.2 | Conestoga | Pennsylvania |
| January 16, 1994 | 4.2 | Sinking Spring | Pennsylvania |
| November 3, 1975 | 4 | Long Lake | New York |
| June 17, 1991 | 4 | Worcester | New York |
The largest earthquake in U.S. history, however, was the 1964 Good Friday quake in Alaska, measuring 9.2 magnitude and killing 131 people.

-

 Business2 weeks ago
America’s Top Companies by Revenue (1994 vs. 2023)
-

 Environment1 week ago
Ranked: Top Countries by Total Forest Loss Since 2001
-

 Markets1 week ago
Visualizing America’s Shortage of Affordable Homes
-

 Maps2 weeks ago
Mapped: Average Wages Across Europe
-

 Mining2 weeks ago
Charted: The Value Gap Between the Gold Price and Gold Miners
-

 Demographics2 weeks ago
Visualizing the Size of the Global Senior Population
-

 Misc2 weeks ago
Tesla Is Once Again the World’s Best-Selling EV Company
-

 Technology2 weeks ago
Ranked: The Most Popular Smartphone Brands in the U.S.