Technology
Mapped: Facebook’s Path to Social Network Domination (2008-2020)
How to Use: The below maps will animate automatically. To pause, move your cursor on the image. Arrows on left/right navigate.


Facebook’s Path to Global Social Network Domination
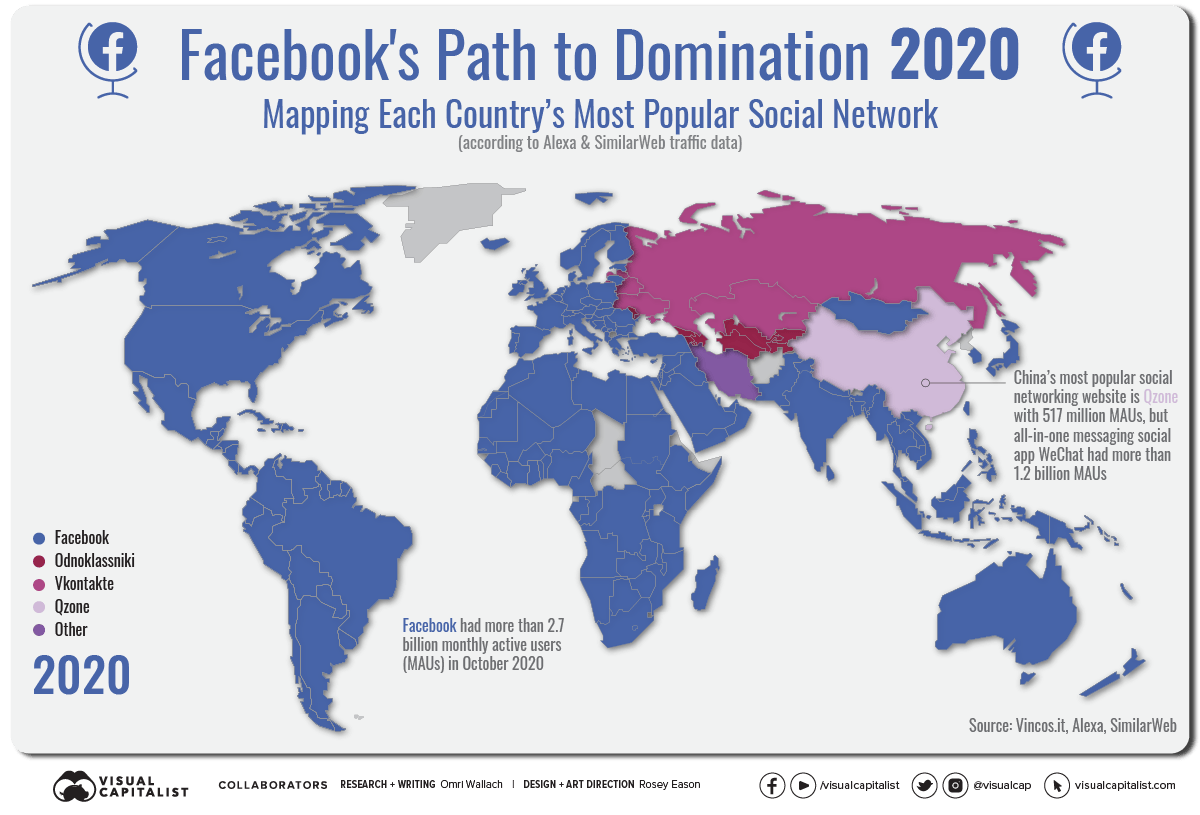
From just a few thousand users in 2004 to 2.7 billion monthly active users (MAUs) in 2020, Facebook is by far the world’s largest social network.
But its massive global footprint didn’t grow overnight. While Facebook is the most popular social network in many countries, this traction didn’t happen overnight. And in other places, it still hasn’t quite taken off.
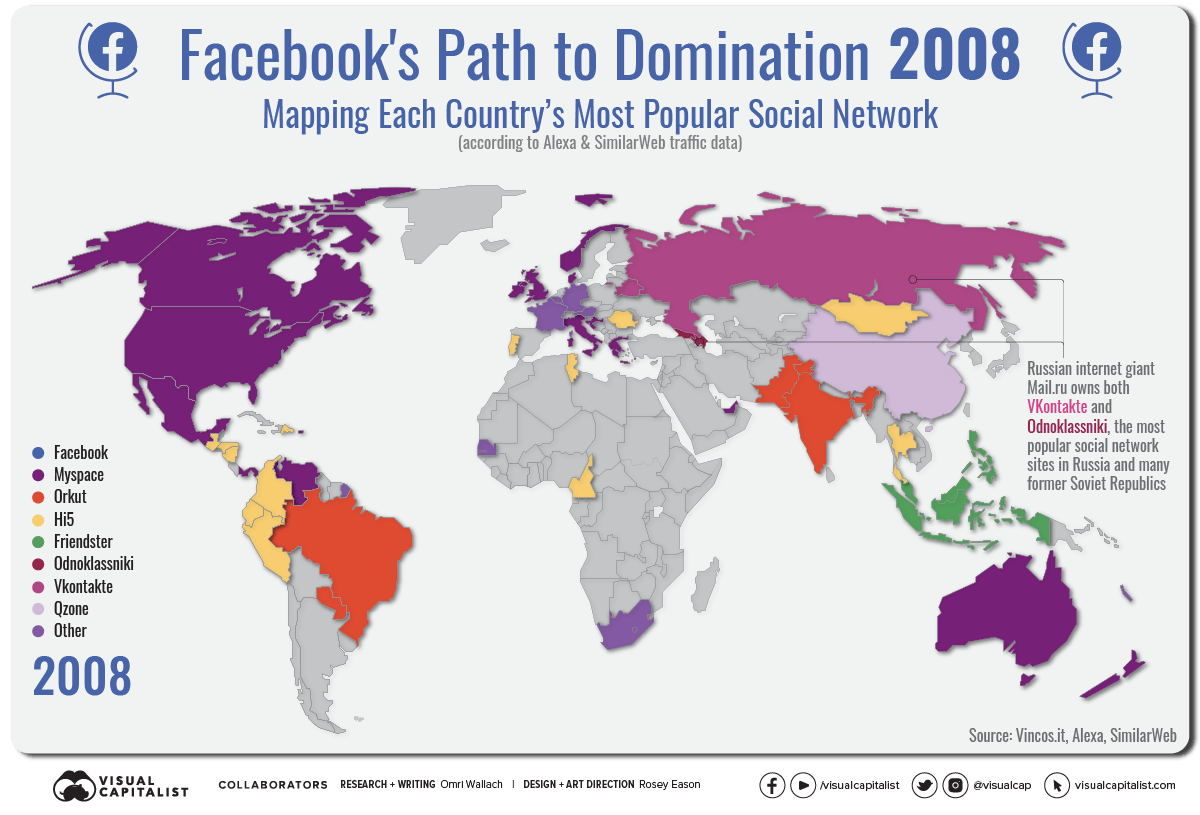
To see Facebook’s path to domination, we mapped each country’s most popular social network from 2008‒2020. The data was tabulated by Vincenzo Cosenza at Vincos.it by examining annual traffic data from Alexa and SimilarWeb.
Facebook Grows From the Americas to Southeast Asia
What famously started as Mark Zuckerberg’s late-night intoxicated project called Facemash—a “hot or not” type website for students at Harvard University—soon evolved into the world’s predominant social network.
Before 2008, the social network landscape was populated by social network pioneers such as Myspace and Hi5. Google’s Orkut was the most popular network in Brazil and India, and Friendster found a foothold in Southeast Asia.
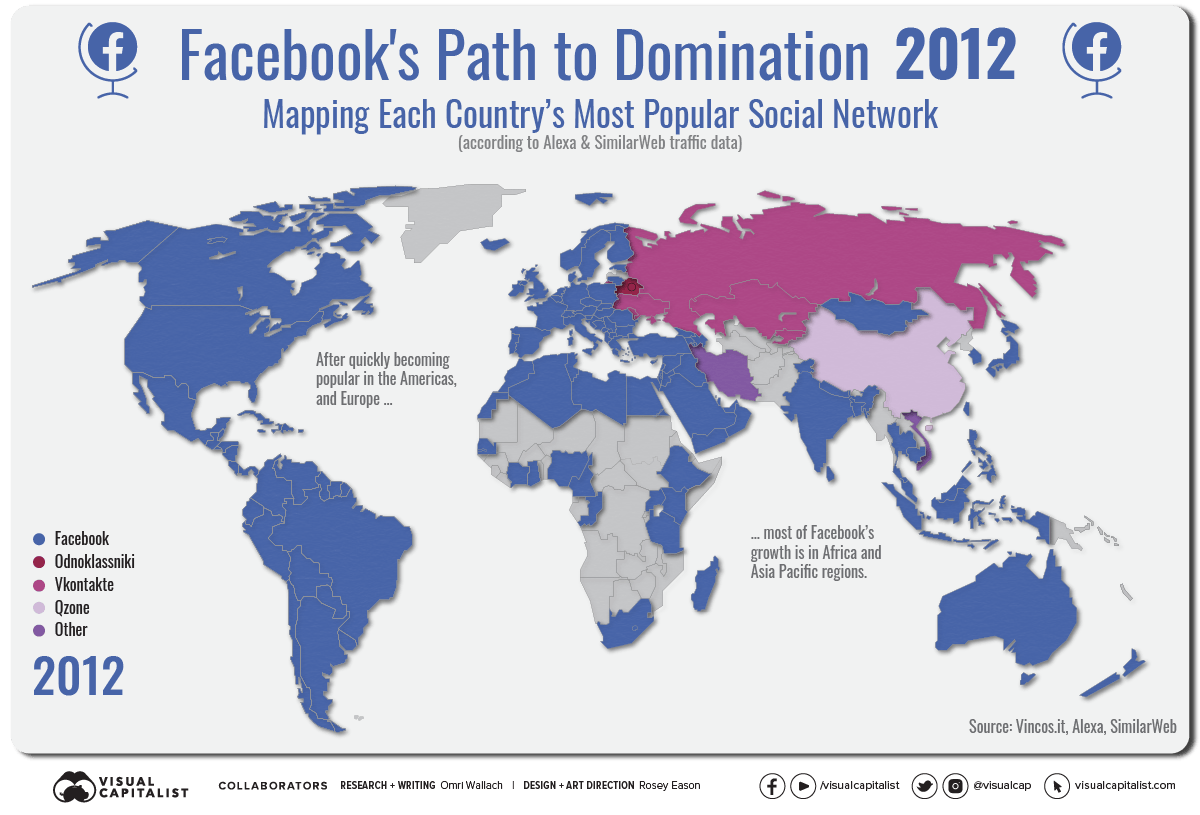
But the Facebook wave came in earnest. By 2009, the social media giant took the title of most popular network for the bulk of the Americas, Europe, South Asia, and Oceania, with Orkut in Brazil being the sole holdout until 2011.
The story was similar in Africa, as increasing internet traffic data pointed to Facebook dominating the social network landscape across the continent (minus a temporary LinkedIn surge in 2017 for Zimbabwe, Ethiopia, Kenya, and Cameroon).
By the beginning of 2020, Facebook was measured as the leading social network site in 151 out of 167 measured countries, or over 90%.
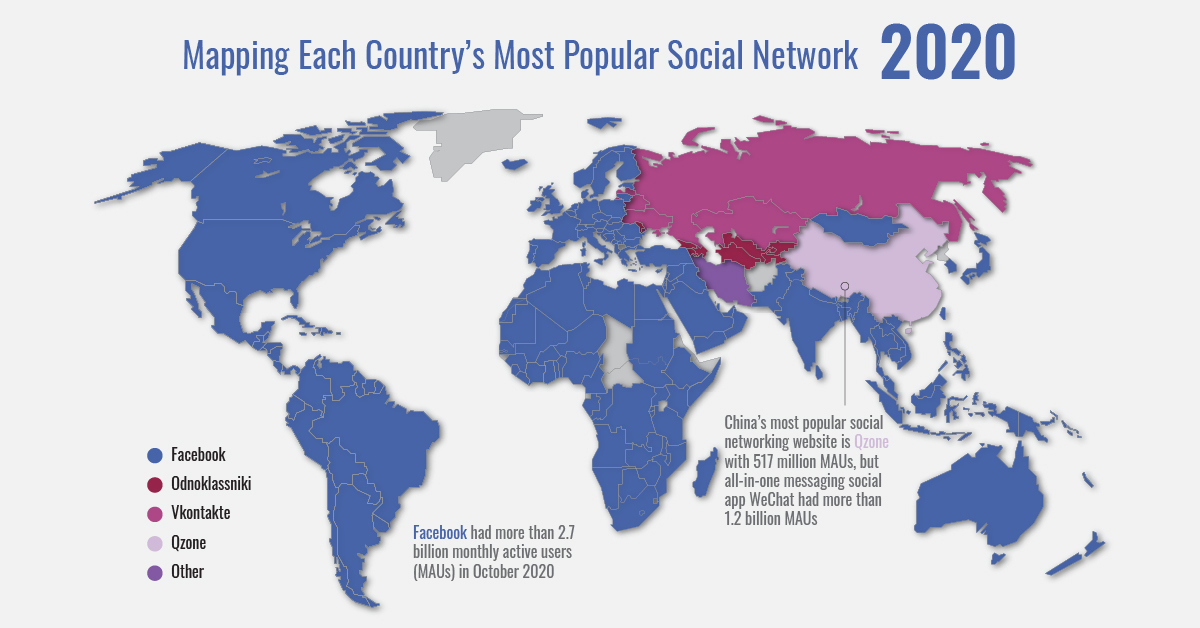
China and Russia Resist Facebook’s Pull
The social giant’s growth, however, didn’t come without resistance.
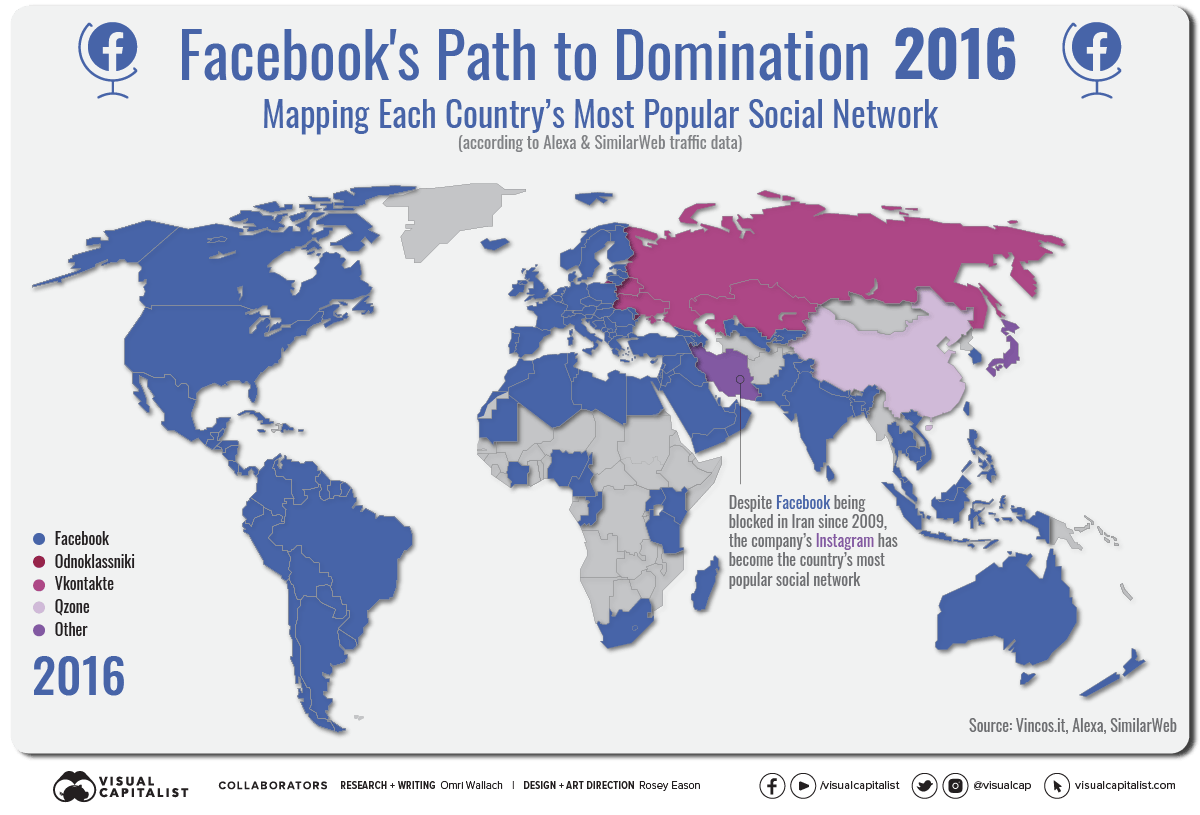
China’s most popular social networking website has been Tencent’s Qzone since the mid-2000s. WeChat—a popular all-in-one messaging platform—does not technically qualify for the above map as a “social networking website”, but the app now has more than 1.2 billion MAUs. Facebook had attempted to gain ground in the country but was banned in 2009.
Similarly in Iran, Facebook was also blocked first in 2009 and then intermittently since. Instead, Iran’s most popular social networks have been Persian sites Cloob and Facenama between 2009‒2016. Facebook did manage to capture the #1 spot briefly in 2011, but since then, they’ve been displaced by Facebook-owned Instagram.
The other countries that Facebook has had trouble capturing, despite not being blocked, are Russia and many former Soviet republics. There, social network dominance has switched regularly between the networks VKontakte and Odnoklassniki, both owned by Mail.ru, a Russian internet giant.
Facebook’s Monopoly Over Mobile Social Networks
As big of a footprint as Facebook has on social networking, the tech giant’s reach is magnified when factoring in mobile apps that it also owns.
In 2020, the company saw 1.3 billion MAUs on Facebook’s Messenger app, 2 billion MAUs on the world’s most popular messaging app WhatsApp, and just under 1.2 billion MAUs on photo sharing network Instagram.
By Facebook’s own estimates in its Q3 2020 reporting, its core products are used by more than 3.2 billion people every month. That means that 40% of Earth’s population (7.8 billion in December 2020) uses Facebook-owned social media.
The question now is if Facebook’s domination will grow further, or if it’ll begin to subside.
With increasing scrutiny of tech giants, the company is facing massive antitrust lawsuits in the U.S. by federal and state authorities, and other countries are stepping up potential regulation as well. At the same time, Facebook is struggling to reach younger audiences in developed countries, which have increasingly turned to Snap and TikTok instead for social media.
Did 2020 mark the height of Facebook’s global empire, or is it just another milestone on the path towards further domination?


Technology
Ranked: Semiconductor Companies by Industry Revenue Share
Nvidia is coming for Intel’s crown. Samsung is losing ground. AI is transforming the space. We break down revenue for semiconductor companies.


Semiconductor Companies by Industry Revenue Share
This was originally posted on our Voronoi app. Download the app for free on Apple or Android and discover incredible data-driven charts from a variety of trusted sources.
Did you know that some computer chips are now retailing for the price of a new BMW?
As computers invade nearly every sphere of life, so too have the chips that power them, raising the revenues of the businesses dedicated to designing them.
But how did various chipmakers measure against each other last year?
We rank the biggest semiconductor companies by their percentage share of the industry’s revenues in 2023, using data from Omdia research.
Which Chip Company Made the Most Money in 2023?
Market leader and industry-defining veteran Intel still holds the crown for the most revenue in the sector, crossing $50 billion in 2023, or 10% of the broader industry’s topline.
All is not well at Intel, however, with the company’s stock price down over 20% year-to-date after it revealed billion-dollar losses in its foundry business.
| Rank | Company | 2023 Revenue | % of Industry Revenue |
|---|---|---|---|
| 1 | Intel | $51B | 9.4% |
| 2 | NVIDIA | $49B | 9.0% |
| 3 | Samsung Electronics | $44B | 8.1% |
| 4 | Qualcomm | $31B | 5.7% |
| 5 | Broadcom | $28B | 5.2% |
| 6 | SK Hynix | $24B | 4.4% |
| 7 | AMD | $22B | 4.1% |
| 8 | Apple | $19B | 3.4% |
| 9 | Infineon Tech | $17B | 3.2% |
| 10 | STMicroelectronics | $17B | 3.2% |
| 11 | Texas Instruments | $17B | 3.1% |
| 12 | Micron Technology | $16B | 2.9% |
| 13 | MediaTek | $14B | 2.6% |
| 14 | NXP | $13B | 2.4% |
| 15 | Analog Devices | $12B | 2.2% |
| 16 | Renesas Electronics Corporation | $11B | 1.9% |
| 17 | Sony Semiconductor Solutions Corporation | $10B | 1.9% |
| 18 | Microchip Technology | $8B | 1.5% |
| 19 | Onsemi | $8B | 1.4% |
| 20 | KIOXIA Corporation | $7B | 1.3% |
| N/A | Others | $126B | 23.2% |
| N/A | Total | $545B | 100% |
Note: Figures are rounded. Totals and percentages may not sum to 100.
Meanwhile, Nvidia is very close to overtaking Intel, after declaring $49 billion of topline revenue for 2023. This is more than double its 2022 revenue ($21 billion), increasing its share of industry revenues to 9%.
Nvidia’s meteoric rise has gotten a huge thumbs-up from investors. It became a trillion dollar stock last year, and broke the single-day gain record for market capitalization this year.
Other chipmakers haven’t been as successful. Out of the top 20 semiconductor companies by revenue, 12 did not match their 2022 revenues, including big names like Intel, Samsung, and AMD.
The Many Different Types of Chipmakers
All of these companies may belong to the same industry, but they don’t focus on the same niche.
According to Investopedia, there are four major types of chips, depending on their functionality: microprocessors, memory chips, standard chips, and complex systems on a chip.
Nvidia’s core business was once GPUs for computers (graphics processing units), but in recent years this has drastically shifted towards microprocessors for analytics and AI.
These specialized chips seem to be where the majority of growth is occurring within the sector. For example, companies that are largely in the memory segment—Samsung, SK Hynix, and Micron Technology—saw peak revenues in the mid-2010s.

-

 Maps2 weeks ago
Mapped: Average Wages Across Europe
-

 Money1 week ago
Which States Have the Highest Minimum Wage in America?
-

 Real Estate1 week ago
Ranked: The Most Valuable Housing Markets in America
-

 Markets1 week ago
Charted: Big Four Market Share by S&P 500 Audits
-

 AI1 week ago
The Stock Performance of U.S. Chipmakers So Far in 2024
-

 Automotive2 weeks ago
Almost Every EV Stock is Down After Q1 2024
-

 Money2 weeks ago
Where Does One U.S. Tax Dollar Go?
-

 Green2 weeks ago
Ranked: Top Countries by Total Forest Loss Since 2001