Energy
Map: The Countries With the Most Oil Reserves
Map: The Countries With the Most Oil Reserves
There’s little doubt that renewable energy sources will play a strategic role in powering the global economy of the future.
But for now, crude oil is still the undisputed heavyweight champion of the energy world.
In 2018, we consumed more oil than any prior year in history – about 99.3 million barrels per day on a global basis. This number is projected to rise again in 2019 to 100.8 million barrels per day.
The Most Oil Reserves by Country
Given that oil will continue to be dominant in the energy mix for the short and medium term, which countries hold the most oil reserves?
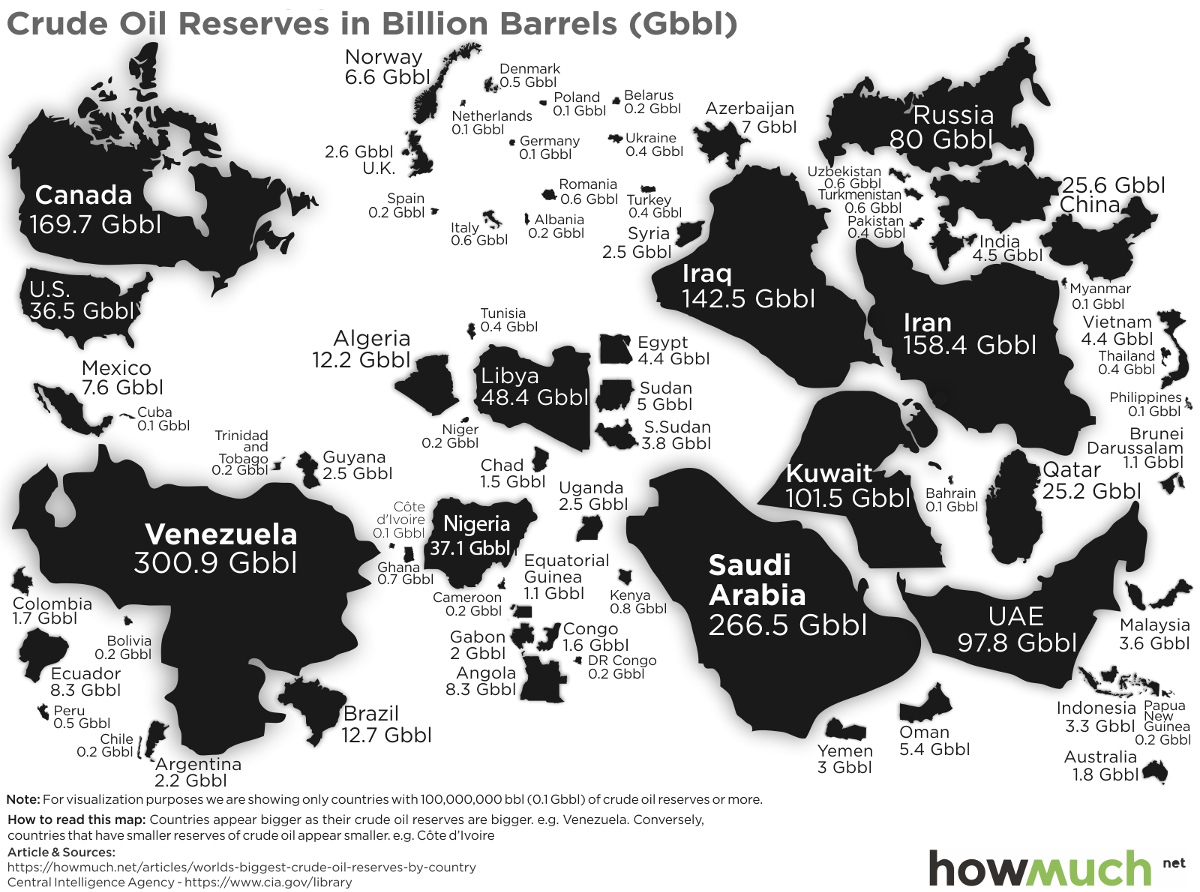
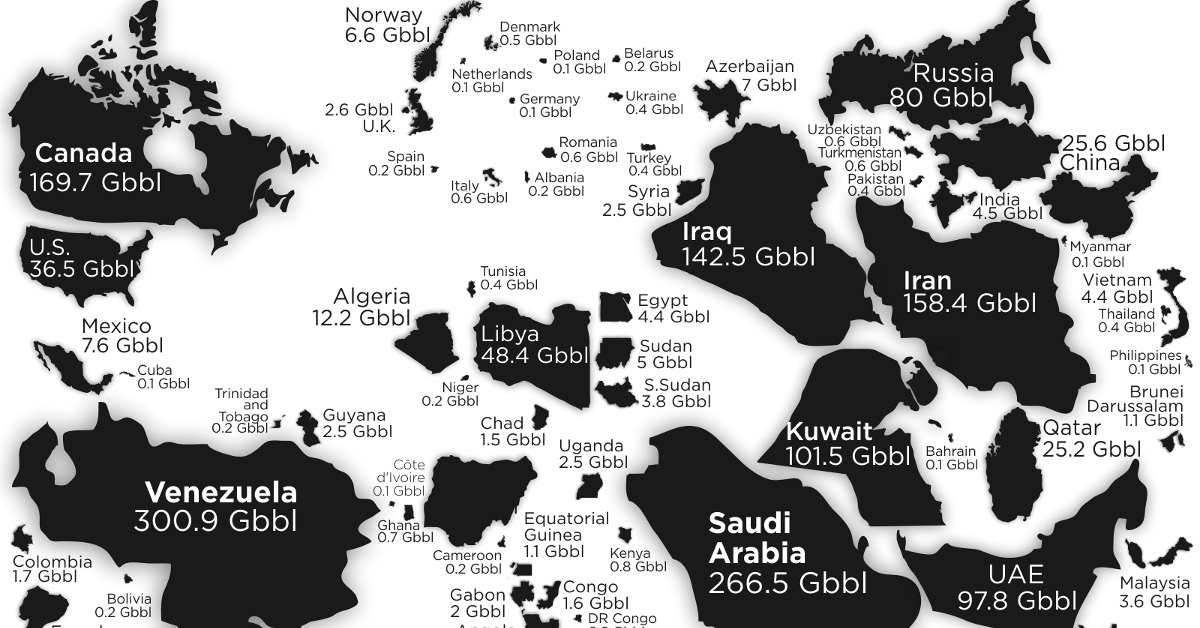
Today’s map comes from HowMuch.net and it uses data from the CIA World Factbook to resize countries based on the amount of oil reserves they hold.
Here’s the data for the top 15 countries below:
| Rank | Country | Oil Reserves (Barrels) |
|---|---|---|
| #1 | 🇻🇪 Venezuela | 300.9 billion |
| #2 | 🇸🇦 Saudi Arabia | 266.5 billion |
| #3 | 🇨🇦 Canada | 169.7 billion |
| #4 | 🇮🇷 Iran | 158.4 billion |
| #5 | 🇮🇶 Iraq | 142.5 billion |
| #6 | 🇰🇼 Kuwait | 101.5 billion |
| #7 | 🇦🇪 United Arab Emirates | 97.8 billion |
| #8 | 🇷🇺 Russia | 80.0 billion |
| #9 | 🇱🇾 Libya | 48.4 billion |
| #10 | 🇳🇬 Nigeria | 37.1 billion |
| #11 | 🇺🇸 United States | 36.5 billion |
| #12 | 🇰🇿 Kazakhstan | 30.0 billion |
| #13 | 🇨🇳 China | 25.6 billion |
| #14 | 🇶🇦 Qatar | 25.2 billion |
| #15 | 🇧🇷 Brazil | 12.7 billion |
Venezuela tops the list with 300.9 billion barrels of oil in reserve – but even this vast wealth in natural resources has not been enough to save the country from its recent economic and humanitarian crisis.
Saudi Arabia, a country known for its oil dominance, takes the #2 spot with 266.5 billion barrels of oil. Meanwhile, Canada and the U.S. are found at the #3 (169.7 billion bbls) and the #11 (36.5 billion bbls) spots respectively.
The Cost of Production
While having an endowment of billions of barrels of oil within your borders can be a strategic gift from mother nature, it’s worth mentioning that reserves are just one factor in assessing the potential value of this crucial resource.
In Saudi Arabia, for example, the production cost of oil is roughly $3.00 per barrel, which makes black gold strategic to produce at almost any possible price.
Other countries are not so lucky:
| Country | Production cost (bbl) | Total cost (bbl)* |
|---|---|---|
| 🇬🇧 United Kingdom | $17.36 | $44.33 |
| 🇧🇷 Brazil | $9.45 | $34.99 |
| 🇳🇬 Nigeria | $8.81 | $28.99 |
| 🇻🇪 Venezuela | $7.94 | $27.62 |
| 🇨🇦 Canada | $11.56 | $26.64 |
| 🇺🇸 U.S. shale | $5.85 | $23.35 |
| 🇳🇴 Norway | $4.24 | $21.31 |
| 🇺🇸 U.S. non-shale | $5.15 | $20.99 |
| 🇮🇩 Indonesia | $6.87 | $19.71 |
| 🇷🇺 Russia | $2.98 | $19.21 |
| 🇮🇶 Iraq | $2.16 | $10.57 |
| 🇮🇷 Iran | $1.94 | $9.09 |
| 🇸🇦 Saudi Arabia | $3.00 | $8.98 |
Even if a country is blessed with some of the most oil reserves in the world, it may not be able to produce and sell that oil to maximize the potential benefit.
Countries like Canada and Venezuela are hindered by geology – in these places, the majority of oil is extra heavy crude or bitumen (oil sands), and these types of oil are simply more difficult and costly to extract.
In other places, obstacles are are self-imposed. In some countries, like Brazil and the U.S., there are higher taxes on oil production, which raises the total cost per barrel.


Energy
The World’s Biggest Nuclear Energy Producers
China has grown its nuclear capacity over the last decade, now ranking second on the list of top nuclear energy producers.


The World’s Biggest Nuclear Energy Producers
This was originally posted on our Voronoi app. Download the app for free on Apple or Android and discover incredible data-driven charts from a variety of trusted sources.
Scientists in South Korea recently broke a record in a nuclear fusion experiment. For 48 seconds, they sustained a temperature seven times that of the sun’s core.
But generating commercially viable energy from nuclear fusion still remains more science fiction than reality. Meanwhile, its more reliable sibling, nuclear fission, has been powering our world for many decades.
In this graphic, we visualized the top producers of nuclear energy by their share of the global total, measured in terawatt hours (TWh). Data for this was sourced from the Nuclear Energy Institute, last updated in August 2022.
Which Country Generates the Most Nuclear Energy?
Nuclear energy production in the U.S. is more than twice the amount produced by China (ranked second) and France (ranked third) put together. In total, the U.S. accounts for nearly 30% of global nuclear energy output.
However, nuclear power only accounts for one-fifth of America’s electricity supply. This is in contrast to France, which generates 60% of its electricity from nuclear plants.
| Rank | Country | Nuclear Energy Produced (TWh) | % of Total |
|---|---|---|---|
| 1 | 🇺🇸 U.S. | 772 | 29% |
| 2 | 🇨🇳 China | 383 | 14% |
| 3 | 🇫🇷 France | 363 | 14% |
| 4 | 🇷🇺 Russia | 208 | 8% |
| 5 | 🇰🇷 South Korea | 150 | 6% |
| 6 | 🇨🇦 Canada | 87 | 3% |
| 7 | 🇺🇦 Ukraine | 81 | 3% |
| 8 | 🇩🇪 Germany | 65 | 2% |
| 9 | 🇯🇵 Japan | 61 | 2% |
| 10 | 🇪🇸 Spain | 54 | 2% |
| 11 | 🇸🇪 Sweden | 51 | 2% |
| 12 | 🇧🇪 Belgium | 48 | 2% |
| 13 | 🇬🇧 UK | 42 | 2% |
| 14 | 🇮🇳 India | 40 | 2% |
| 15 | 🇨🇿 Czech Republic | 29 | 1% |
| N/A | 🌐 Other | 219 | 8% |
| N/A | 🌍 Total | 2,653 | 100% |
Another highlight is how China has rapidly grown its nuclear energy capabilities in the last decade. Between 2016 and 2021, for example, it increased its share of global nuclear energy output from less than 10% to more than 14%, overtaking France for second place.
On the opposite end, the UK’s share has slipped to 2% over the same time period.
Meanwhile, Ukraine has heavily relied on nuclear energy to power its grid. In March 2022, it lost access to its key Zaporizhzhia Nuclear Power Station after Russian forces wrested control of the facility. With six 1,000 MW reactors, the plant is one of the largest in Europe. It is currently not producing any power, and has been the site of recent drone attacks.

-

 Maps2 weeks ago
Mapped: Average Wages Across Europe
-

 Money1 week ago
Which States Have the Highest Minimum Wage in America?
-

 Real Estate1 week ago
Ranked: The Most Valuable Housing Markets in America
-

 Markets1 week ago
Charted: Big Four Market Share by S&P 500 Audits
-

 AI1 week ago
The Stock Performance of U.S. Chipmakers So Far in 2024
-

 Automotive2 weeks ago
Almost Every EV Stock is Down After Q1 2024
-

 Money2 weeks ago
Where Does One U.S. Tax Dollar Go?
-

 Green2 weeks ago
Ranked: Top Countries by Total Forest Loss Since 2001