Money
How Many U.S. Dollar Bills Are There in Circulation?
How Many U.S. Dollar Bills Are There in Circulation?
When you think about it, the journey of each individual currency note is pretty incredible.
After being printed or minted, each bill is then passed between people and businesses to facilitate transactions. If it’s a $1 or $5 bill, it changes hands on average about 110 times per year – and if it’s a $20 bill, it’s more like 75. The interesting part is that almost every transaction is linked to the one before it, and the series of subsequent transactions for each bill creates a unique, broad story.
By the time a bill is retired, it would have facilitated many hundreds of transactions that enabled everything from the purchase of used cars to the shadier deals in underground markets. It’s a pretty interesting tale for such a little piece of paper.
Dollar Bills, in Aggregate
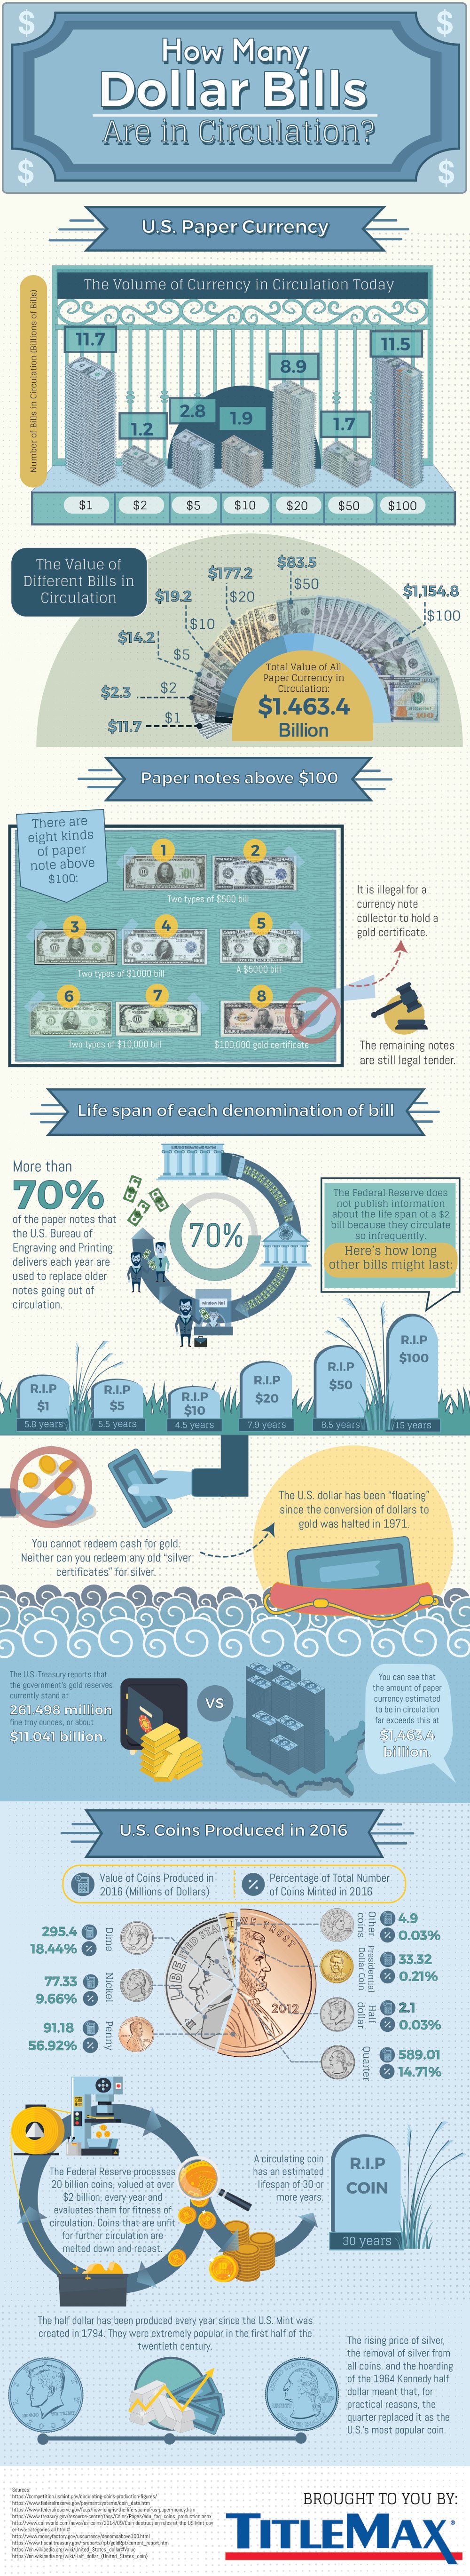
Today’s infographic from TitleMax gives a sense of what happens when all of those individual stories are combined together into one large one: the U.S. supply of currency notes, the shelf life of each type of bill, and how the whole system works as a whole.
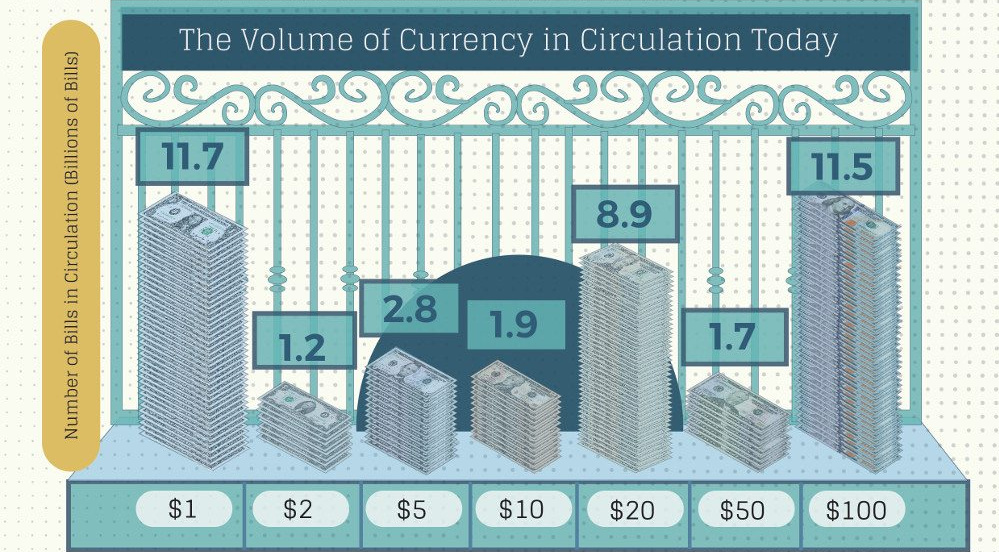
In total, there is a total of about $1.5 trillion in U.S. physical currency in circulation, and roughly 80% of this value comes from the 11.5 billion $100 notes that are in circulation.
| Note | Number of bills in circulation |
|---|---|
| $1 bill | 11.7 billion |
| $2 bill | 1.2 billion |
| $5 bill | 2.8 billion |
| $10 bill | 1.9 billion |
| $20 bill | 8.9 billion |
| $50 bill | 1.7 billion |
| $100 bill | 11.5 billion |
Of course, as we showed in All the World’s Money and Markets, this is just a fraction of the total money that exists as a whole, which includes digital deposits and liquidity added by central banks. That’s why, in the U.S. today, there’s about $14 trillion in total money supply (M2), of which physical currency makes up only about 11% of the total value.
Turnover Per Bill
Every year, the U.S. Bureau of Engraving and Printing is responsible for printing new dollars – and interestingly, 70% of these new bills are used to replace older notes going out of circulation.
That raises the question: how long does each bill last on average?
| Note | Average Life Span |
|---|---|
| $1 bill | 5.8 years |
| $5 bill | 5.5 years |
| $10 bill | 4.5 years |
| $20 bill | 7.9 years |
| $50 bill | 8.5 years |
| $100 bill | 15.0 years |
This means that printers are mostly turning out new batches of $1 and $20 bills, since there are more of those in circulation than most other bills.
At the same time, many new $100 notes are also being printed as well since they are the second most common bill. However, these last 2-3x as long as smaller denominations.


Money
Charted: Who Has Savings in This Economy?
Older, better-educated adults are winning the savings game, reveals a January survey by the National Opinion Research Center at the University of Chicago.


Who Has Savings in This Economy?
This was originally posted on our Voronoi app. Download the app for free on iOS or Android and discover incredible data-driven charts from a variety of trusted sources.
Two full years of inflation have taken their toll on American households. In 2023, the country’s collective credit card debt crossed $1 trillion for the first time. So who is managing to save money in the current economic environment?
We visualize the percentage of respondents to the statement “I have money leftover at the end of the month” categorized by age and education qualifications. Data is sourced from a National Endowment for Financial Education (NEFE) report, published last month.
The survey for NEFE was conducted from January 12-14, 2024, by the National Opinion Research Center at the University of Chicago. It involved 1,222 adults aged 18+ and aimed to be representative of the U.S. population.
Older Americans Save More Than Their Younger Counterparts
General trends from this dataset indicate that as respondents get older, a higher percentage of them are able to save.
| Age | Always/Often | Sometimes | Rarely/Never |
|---|---|---|---|
| 18–29 | 29% | 33% | 38% |
| 30–44 | 36% | 27% | 37% |
| 45–59 | 39% | 23% | 38% |
| Above 60 | 49% | 28% | 23% |
| All Adults | 39% | 33% | 27% |
Note: Percentages are rounded and may not sum to 100.
Perhaps not surprisingly, those aged 60+ are the age group with the highest percentage saying they have leftover money at the end of the month. This age group spent the most time making peak earnings in their careers, are more likely to have investments, and are more likely to have paid off major expenses like a mortgage or raising a family.
The Impact of Higher Education on Earnings and Savings
Based on this survey, higher education dramatically improves one’s ability to save. Shown in the table below, those with a bachelor’s degree or higher are three times more likely to have leftover money than those without a high school diploma.
| Education | Always/Often | Sometimes | Rarely/Never |
|---|---|---|---|
| No HS Diploma | 18% | 26% | 56% |
| HS Diploma | 28% | 33% | 39% |
| Associate Degree | 33% | 31% | 36% |
| Bachelor/Higher Degree | 59% | 21% | 20% |
| All Adults | 39% | 33% | 27% |
Note: Percentages are rounded and may not sum to 100.
As the Bureau of Labor Statistics notes, earnings improve with every level of education completed.
For example, those with a high school diploma made 25% more than those without in 2022. And as the qualifications increase, the effects keep stacking.
Meanwhile, a Federal Reserve study also found that those with more education tended to make financial decisions that contributed to building wealth, of which the first step is to save.

-

 Markets1 week ago
U.S. Debt Interest Payments Reach $1 Trillion
-

 Business2 weeks ago
Charted: Big Four Market Share by S&P 500 Audits
-

 Markets2 weeks ago
Ranked: The Most Valuable Housing Markets in America
-

 Money2 weeks ago
Which States Have the Highest Minimum Wage in America?
-

 AI2 weeks ago
Ranked: Semiconductor Companies by Industry Revenue Share
-

 Markets2 weeks ago
Ranked: The World’s Top Flight Routes, by Revenue
-

 Demographics2 weeks ago
Population Projections: The World’s 6 Largest Countries in 2075
-

 Markets2 weeks ago
The Top 10 States by Real GDP Growth in 2023