Energy
A Lifetime’s Consumption of Fossil Fuels, Visualized
![]() Subscribe to the Elements free mailing list for more like this
Subscribe to the Elements free mailing list for more like this
Visualizing the Fossil Fuels we Consume in a Lifetime
This was originally posted on Elements. Sign up to the free mailing list to get beautiful visualizations on natural resource megatrends in your email every week.
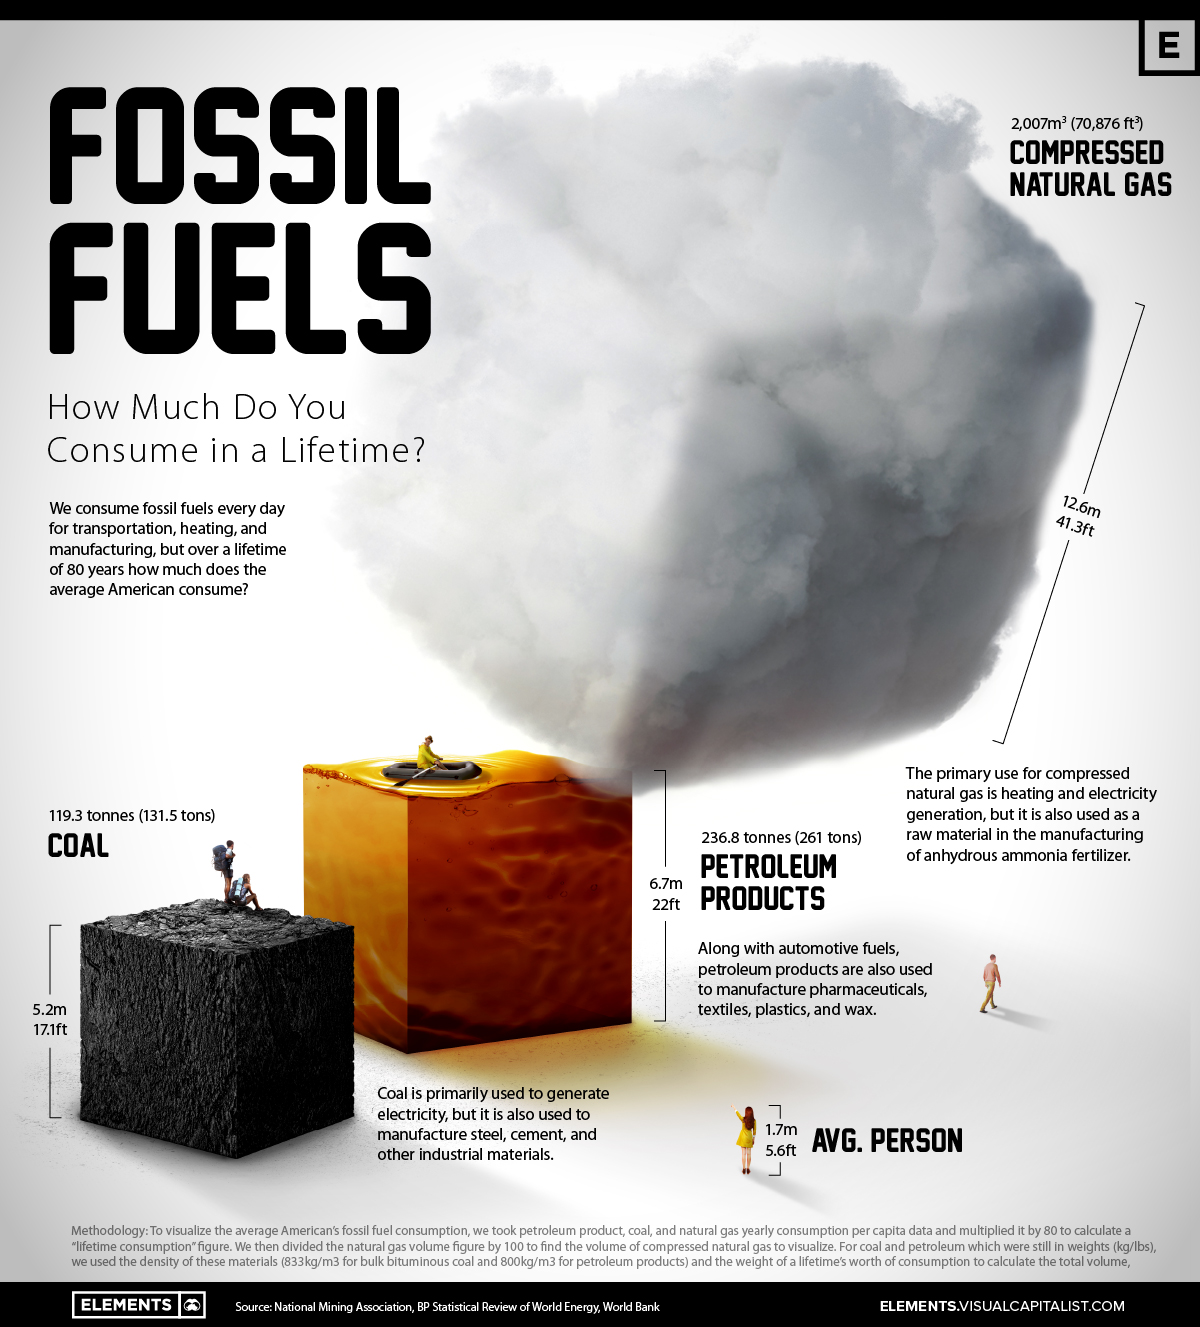
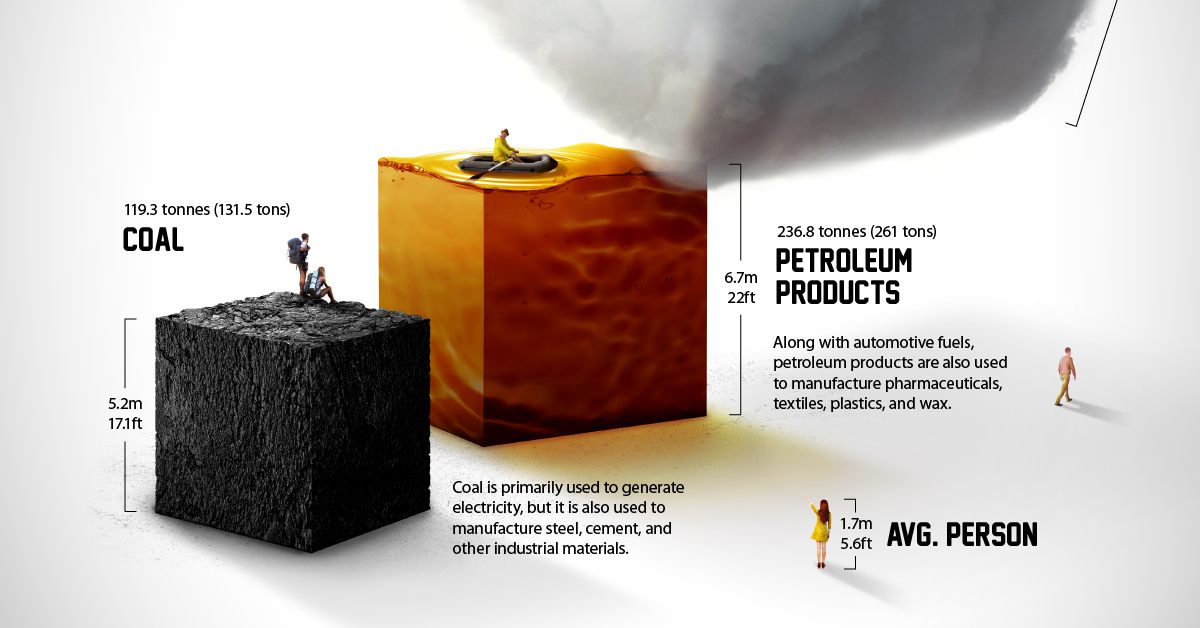
From burning natural gas to heat our homes to the petroleum-based materials found in everyday products like pharmaceuticals and plastics, we all consume fossil fuels in one form or another.
In 2021, the world consumed nearly 490 exajoules of fossil fuels, an unfathomable figure of epic proportions.
To put fossil fuel consumption into perspective on a more individual basis, this graphic visualizes the average person’s fossil fuel use over a lifetime of 80 years using data from the National Mining Association and BP’s Statistical Review of World Energy.
How Many Fossil Fuels a Person Consumes Every Year
On a day-to-day basis, our fossil fuel consumption might seem minimal, however, in just a year the average American consumes more than 23 barrels of petroleum products like gasoline, propane, or jet fuel.
The cube of the average individual’s yearly petroleum product consumption reaches around 1.5 meters (4.9 feet) tall. When you consider varying transportation choices and lifestyles, from public transit to private jets, the yearly cube of petroleum product consumption for some people may easily overtake their height.
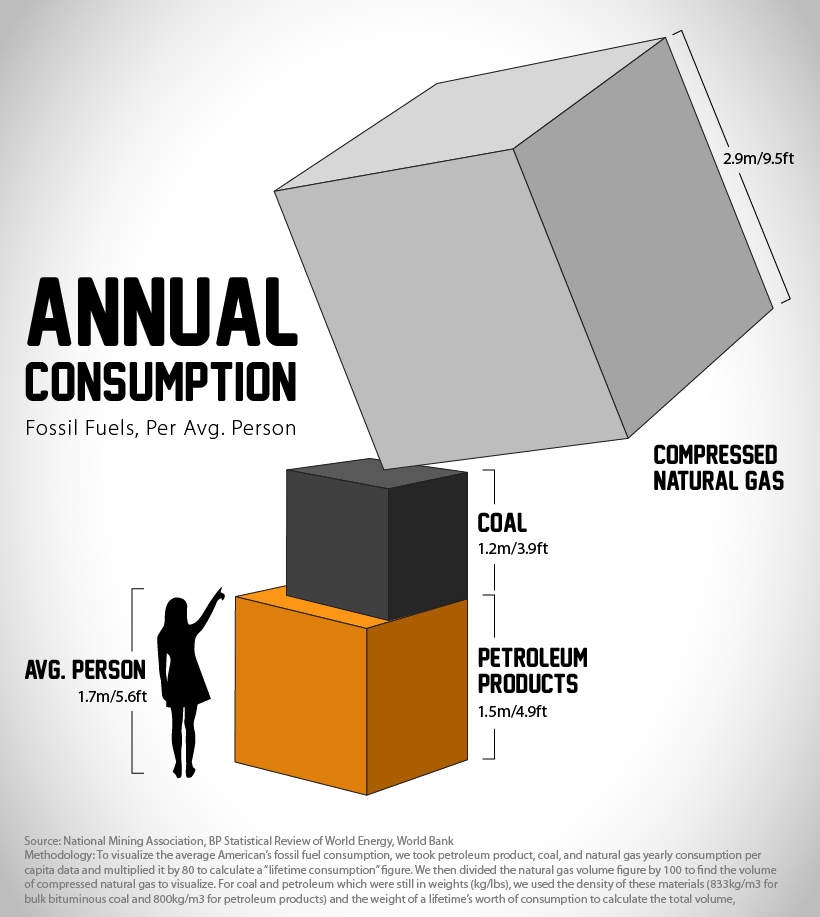
To calculate the volume needed to visualize the petroleum products and coal cubes (natural gas figures were already in volume format), we used the densities of bulk bituminous coal (833kg/m3) and petroleum products (800kg/m3) along with the weights of per capita consumption in the U.S. from the National Mining Association.
These figures are averages, and can differ per person depending on a region’s energy mix, transportation choices, and consumption habits, along with other factors.
Global Fossil Fuel Consumption Rebounds Post-Pandemic
When the global economy reopened post-pandemic, energy demand and consumption rebounded past 2019 levels with fossil fuels largely leading the way. While global primary energy demand grew 5.8% in 2021, coal consumption rose by 6% reaching highs not seen since 2014.
In 2021, renewables and hydroelectricity made up nearly 14% of the world’s primary energy use, with fossil fuels (oil, natural gas, and coal) accounting for 82% (down from 83% in 2020), and nuclear energy accounting for the remaining 4%.
Recent demand for fossil fuels has been underpinned by their reliability as generating energy from renewables in Germany has been inconsistent when it’s been needed most.
Now the country grapples with energy rations as it restarts coal-fired power plants in response to its overdependence on Russian fossil fuel energy as the potential permanence of the Nord Stream 1 natural gas pipeline shutdown looms.
Growing Green Energy Amidst Geopolitical Instability
Domestic energy and material supply chain independence quickly became a top priority for many nations amidst Russia’s invasion of Ukraine, Western trade sanctions, and increasingly unpredictable COVID-19 lockdowns in China.
Trade and energy dependence risks still remain a major concern as many nations transition towards renewable energy. For example, essential rare earth mineral production, and solar PV manufacturing supply chains remain dominated by China.
Despite looming storm clouds over global energy and materials trade, renewable energy’s green linings are growing on the global scale. The world’s renewable primary energy consumption reached an annual growth rate of 15%, outgrowing all other energy fuels as wind and solar provided a milestone 10% of global electricity in 2021.
If the global energy mix continues to get greener fast enough, the cubes of our personal fossil fuel consumption may manage to get smaller in the future.


Energy
Charted: 4 Reasons Why Lithium Could Be the Next Gold Rush
Visual Capitalist has partnered with EnergyX to show why drops in prices and growing demand may make now the right time to invest in lithium.


4 Reasons Why You Should Invest in Lithium
Lithium’s importance in powering EVs makes it a linchpin of the clean energy transition and one of the world’s most precious minerals.
In this graphic, Visual Capitalist partnered with EnergyX to explore why now may be the time to invest in lithium.
1. Lithium Prices Have Dropped
One of the most critical aspects of evaluating an investment is ensuring that the asset’s value is higher than its price would indicate. Lithium is integral to powering EVs, and, prices have fallen fast over the last year:
| Date | LiOH·H₂O* | Li₂CO₃** |
|---|---|---|
| Feb 2023 | $76 | $71 |
| March 2023 | $71 | $61 |
| Apr 2023 | $43 | $33 |
| May 2023 | $43 | $33 |
| June 2023 | $47 | $45 |
| July 2023 | $44 | $40 |
| Aug 2023 | $35 | $35 |
| Sept 2023 | $28 | $27 |
| Oct 2023 | $24 | $23 |
| Nov 2023 | $21 | $21 |
| Dec 2023 | $17 | $16 |
| Jan 2024 | $14 | $15 |
| Feb 2024 | $13 | $14 |
Note: Monthly spot prices were taken as close to the 14th of each month as possible.
*Lithium hydroxide monohydrate MB-LI-0033
**Lithium carbonate MB-LI-0029
2. Lithium-Ion Battery Prices Are Also Falling
The drop in lithium prices is just one reason to invest in the metal. Increasing economies of scale, coupled with low commodity prices, have caused the cost of lithium-ion batteries to drop significantly as well.
In fact, BNEF reports that between 2013 and 2023, the price of a Li-ion battery dropped by 82%.
| Year | Price per KWh |
|---|---|
| 2023 | $139 |
| 2022 | $161 |
| 2021 | $150 |
| 2020 | $160 |
| 2019 | $183 |
| 2018 | $211 |
| 2017 | $258 |
| 2016 | $345 |
| 2015 | $448 |
| 2014 | $692 |
| 2013 | $780 |

3. EV Adoption is Sustainable
One of the best reasons to invest in lithium is that EVs, one of the main drivers behind the demand for lithium, have reached a price point similar to that of traditional vehicle.
According to the Kelly Blue Book, Tesla’s average transaction price dropped by 25% between 2022 and 2023, bringing it in line with many other major manufacturers and showing that EVs are a realistic transport option from a consumer price perspective.
| Manufacturer | September 2022 | September 2023 |
|---|---|---|
| BMW | $69,000 | $72,000 |
| Ford | $54,000 | $56,000 |
| Volkswagon | $54,000 | $56,000 |
| General Motors | $52,000 | $53,000 |
| Tesla | $68,000 | $51,000 |
4. Electricity Demand in Transport is Growing
As EVs become an accessible transport option, there’s an investment opportunity in lithium. But possibly the best reason to invest in lithium is that the IEA reports global demand for the electricity in transport could grow dramatically by 2030:
| Transport Type | 2022 | 2025 | 2030 |
|---|---|---|---|
| Buses 🚌 | 23,000 GWh | 50,000 GWh | 130,000 GWh |
| Cars 🚙 | 65,000 GWh | 200,000 GWh | 570,000 GWh |
| Trucks 🛻 | 4,000 GWh | 15,000 GWh | 94,000 GWh |
| Vans 🚐 | 6,000 GWh | 16,000 GWh | 72,000 GWh |
The Lithium Investment Opportunity
Lithium presents a potentially classic investment opportunity. Lithium and battery prices have dropped significantly, and recently, EVs have reached a price point similar to other vehicles. By 2030, the demand for clean energy, especially in transport, will grow dramatically.
With prices dropping and demand skyrocketing, now is the time to invest in lithium.
EnergyX is poised to exploit lithium demand with cutting-edge lithium extraction technology capable of extracting 300% more lithium than current processes.

-

 Lithium3 days ago
Ranked: The Top 10 EV Battery Manufacturers in 2023
Asia dominates this ranking of the world’s largest EV battery manufacturers in 2023.
-

 Energy1 week ago
The World’s Biggest Nuclear Energy Producers
China has grown its nuclear capacity over the last decade, now ranking second on the list of top nuclear energy producers.
-

 Energy4 weeks ago
The World’s Biggest Oil Producers in 2023
Just three countries accounted for 40% of global oil production last year.
-

 Energy1 month ago
How Much Does the U.S. Depend on Russian Uranium?
Currently, Russia is the largest foreign supplier of nuclear power fuel to the U.S.
-

 Uranium2 months ago
Charted: Global Uranium Reserves, by Country
We visualize the distribution of the world’s uranium reserves by country, with 3 countries accounting for more than half of total reserves.
-

 Energy3 months ago
Visualizing the Rise of the U.S. as Top Crude Oil Producer
Over the last decade, the United States has established itself as the world’s top producer of crude oil, surpassing Saudi Arabia and Russia.


-

 Markets1 week ago
U.S. Debt Interest Payments Reach $1 Trillion
-

 Markets2 weeks ago
Ranked: The Most Valuable Housing Markets in America
-

 Money2 weeks ago
Which States Have the Highest Minimum Wage in America?
-

 AI2 weeks ago
Ranked: Semiconductor Companies by Industry Revenue Share
-

 Markets2 weeks ago
Ranked: The World’s Top Flight Routes, by Revenue
-

 Countries2 weeks ago
Population Projections: The World’s 6 Largest Countries in 2075
-

 Markets2 weeks ago
The Top 10 States by Real GDP Growth in 2023
-

 Money2 weeks ago
The Smallest Gender Wage Gaps in OECD Countries