Datastream
Ranked: The World’s Least Affordable Cities to Buy a Home


The Briefing
- For the 10th year in a row, Hong Kong is the world’s least affordable housing market
- The U.S. is home to a mixture of the most and least affordable housing markets
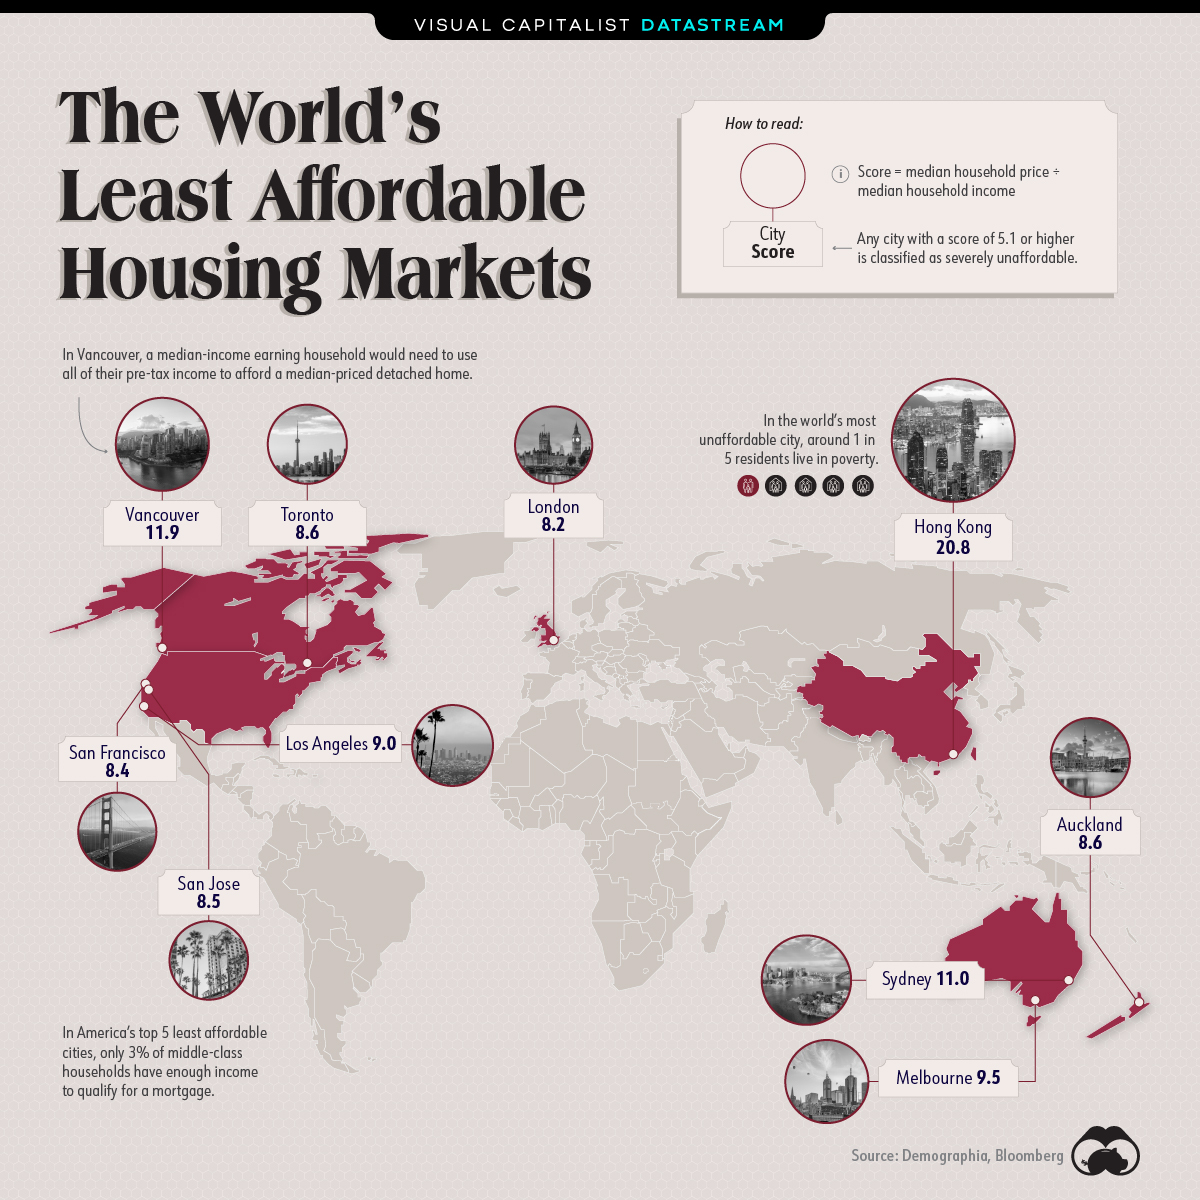
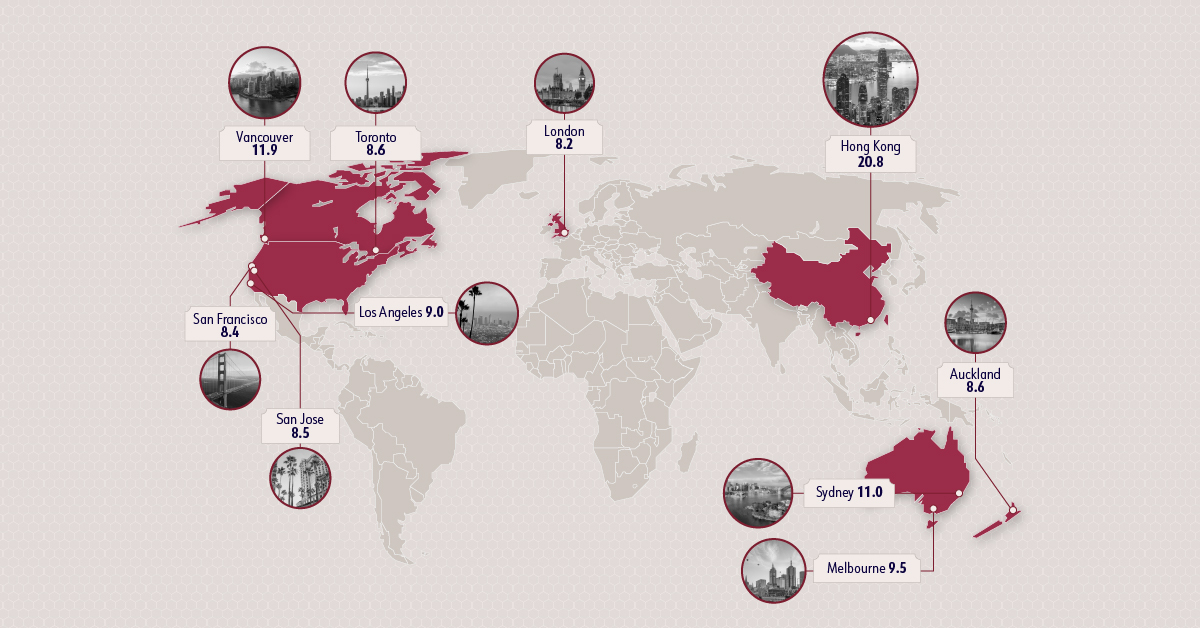
Ranked: The World’s Least Affordable Cities to Buy a Home
In certain parts of the world, housing prices have risen much faster than household incomes, making home ownership increasingly more difficult for the average Joe.
Using data from Demographia published in 2020, this graphic looks at some of the world’s most expensive housing markets.
The Least Affordable Housing Markets
It’s worth noting that this data looks at housing affordability specifically for middle-income earners. While it’s far from globally exhaustive, it measures affordability in 309 major metropolitan areas across Australia, Canada, Hong Kong, Ireland, New Zealand, Singapore, the U.S., and the UK.
In this study, a city’s affordability is calculated by taking its median housing price and dividing it by the median household income.
- Moderately Unaffordable: 3.1 to 4.0
- Seriously Unaffordable: 4.1 to 5.0
- Severely Unaffordable: 5.1+
All the cities on this graphic classify as severely unaffordable. Perhaps unsurprisingly, Hong Kong is the most unaffordable housing market—scoring 20.8 to take the top spot.
| Housing Market | Country | Score |
|---|---|---|
| Hong Kong | 🇨🇳 China (SAR) | 20.8 |
| Vancouver, BC | 🇨🇦 Canada | 11.9 |
| Sydney, NSW | 🇦🇺 Australia | 11.0 |
| Melbourne, VIC | 🇦🇺 Australia | 9.5 |
| Los Angeles, CA | 🇺🇸 United States | 9.0 |
| Auckland | 🇳🇿 New Zealand | 8.6 |
| Toronto, ON | 🇨🇦 Canada | 8.6 |
| San Jose, CA | 🇺🇸 United States | 8.5 |
| San Francisco, CA | 🇺🇸 United States | 8.4 |
| London (Greater London Authority) | 🇬🇧 United Kingdom | 8.2 |
| Honolulu, HI | 🇺🇸 United States | 8.0 |
| San Diego, CA | 🇺🇸 United States | 7.3 |
| Adelaide, SA | 🇦🇺 Australia | 6.9 |
| Bournemouth & Dorset | 🇬🇧 United Kingdom | 6.9 |
Home to 7.5 million people, Hong Kong has ranked as the world’s least affordable city for 10 consecutive years. Because of its steep housing prices, nano apartments have risen in popularity over the last decade.
The Most Affordable Housing Markets
Three of the most expensive housing markets are in America, but at the same time, the country also contains some of the most affordable markets in the eight-country study, too.
In fact, the top 10 most affordable cities are all in America:
| City | Country | Score |
|---|---|---|
| Rochester, NY | 🇺🇸 United States | 2.5 |
| Cleveland, OH | 🇺🇸 United States | 2.7 |
| Oklahoma City, OK | 🇺🇸 United States | 2.7 |
| Buffalo, NY | 🇺🇸 United States | 2.8 |
| Cincinnati, OH-KY-IN | 🇺🇸 United States | 2.8 |
| Pittsburgh, PA | 🇺🇸 United States | 2.8 |
| St. Louis, MO-IL | 🇺🇸 United States | 2.8 |
| Hartford, CT | 🇺🇸 United States | 2.9 |
| Indianapolis. IN | 🇺🇸 United States | 2.9 |
| Tulsa, OK | 🇺🇸 United States | 3.0 |
Keep in mind, these figures are from Q3’2019. Considering the pandemic-induced suburban shuffle that’s been going on in some of America’s major housing markets, this list could look a bit different in Demographia’s next report.
>>Like this? Then you might like this article on The 10 Most Expensive Cities in the World
Where does this data come from?
Source: Demographia
Details: Affordability score is calculated by taking a city’s median housing price and dividing it by the median household income. Anything over 5.1 is considered severely unaffordable
Notes: Data includes 309 metropolitan markets across eight countries, including Australia, Canada, the U.K., and the U.S., as of the third quarter of 2019


Datastream
Can You Calculate Your Daily Carbon Footprint?
Discover how the average person’s carbon footprint impacts the environment and learn how carbon credits can offset your carbon footprint.


The Briefing
- A person’s carbon footprint is substantial, with activities such as food consumption creating as much as 4,500 g of CO₂ emissions daily.
- By purchasing carbon credits from Carbon Streaming Corporation, you can offset your own emissions and fund positive climate action.
Your Everyday Carbon Footprint
While many large businesses and countries have committed to net-zero goals, it is essential to acknowledge that your everyday activities also contribute to global emissions.
In this graphic, sponsored by Carbon Streaming Corporation, we will explore how the choices we make and the products we use have a profound impact on our carbon footprint.
Carbon Emissions by Activity
Here are some of the daily activities and products of the average person and their carbon footprint, according to Clever Carbon.
| Household Activities & Products | CO2 Emissions (g) |
|---|---|
| 💡 Standard Light Bulb (100 watts, four hours) | 172 g |
| 📱 Mobile Phone Use (195 minutes per day)* | 189 g |
| 👕 Washing Machine (0.63 kWh) | 275 g |
| 🔥 Electric Oven (1.56 kWh) | 675 g |
| ♨️ Tumble Dryer (2.5 kWh) | 1,000 g |
| 🧻 Toilet Roll (2 ply) | 1,300 g |
| 🚿 Hot Shower (10 mins) | 2,000 g |
| 🚙 Daily Commute (one hour, by car) | 3,360 g |
| 🍽️ Average Daily Food Consumption (three meals of 600 calories) | 4,500 g |
| *Phone use based on yearly use of 69kg per the source, Reboxed | |
Your choice of transportation plays a crucial role in determining your carbon footprint. For instance, a 15 km daily commute to work on public transport generates an average of 1,464 g of CO₂ emissions. Compared to 3,360 g—twice the volume for a journey the same length by car.
By opting for more sustainable modes of transport, such as cycling, walking, or public transportation, you can significantly reduce your carbon footprint.
Addressing Your Carbon Footprint
One way to compensate for your emissions is by purchasing high-quality carbon credits.
Carbon credits are used to help fund projects that avoid, reduce or remove CO₂ emissions. This includes nature-based solutions such as reforestation and improved forest management, or technology-based solutions such as the production of biochar and carbon capture and storage (CCS).
While carbon credits offer a potential solution for individuals to help reduce global emissions, public awareness remains a significant challenge. A BCG-Patch survey revealed that only 34% of U.S. consumers are familiar with carbon credits, and only 3% have purchased them in the past.
About Carbon Streaming
By financing the creation or expansion of carbon projects, Carbon Streaming Corporation secures the rights to future carbon credits generated by these sustainable projects. You can then purchase these carbon credits to help fund climate solutions around the world and compensate for your own emissions.
Ready to get involved?
>> Learn more about purchasing carbon credits at Carbon Streaming

-

 Mining1 week ago
Gold vs. S&P 500: Which Has Grown More Over Five Years?
-

 Markets2 weeks ago
Ranked: The Most Valuable Housing Markets in America
-

 Money2 weeks ago
Which States Have the Highest Minimum Wage in America?
-

 AI2 weeks ago
Ranked: Semiconductor Companies by Industry Revenue Share
-

 Markets2 weeks ago
Ranked: The World’s Top Flight Routes, by Revenue
-

 Demographics2 weeks ago
Population Projections: The World’s 6 Largest Countries in 2075
-

 Markets2 weeks ago
The Top 10 States by Real GDP Growth in 2023
-

 Demographics2 weeks ago
The Smallest Gender Wage Gaps in OECD Countries