Technology
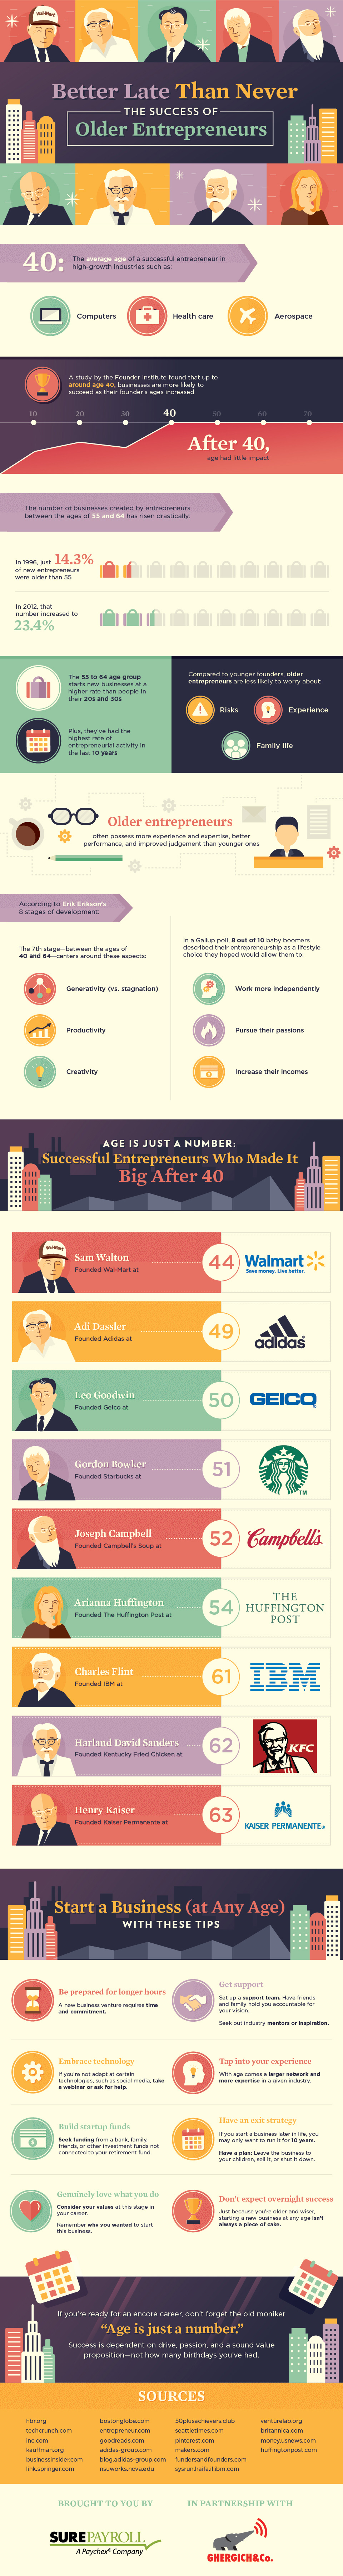
Is Age Just a Number? Big Wins by Older Entrepreneurs
Is Age Just a Number? Big Wins by Older Entrepreneurs
The entrepreneurial archetype that people think of in 2015 is usually some sort of kid-genius programmer or visionary that strikes it big. Think of Mark Zuckerberg, who created co-founded Facebook in his early 20s and launched a multi-billion dollar empire.
However, through society’s reverence for such enigmatic figures, we’ve forgot about a group that gets less appreciation than they deserve: entrepreneurs who launch big businesses closer to their golden years.
Today’s infographic shows that older entrepreneurs are more likely than their younger counterparts to be successful in certain industries. For example, the average successful founder in the computers, health care, and aerospace industries is about 40 years old. Further, a study by the Founders Institute discovered that businesses are more likely to succeed as their founders close in on that same age.
There are actually more entrepreneurs in higher age brackets than before. Just 14.3% of new entrepreneurs in 1996 were older than 55, and in 2012 that number soared to 23.4%. Today, this older segment actually starts new businesses at a higher rate than folks in their 20s or 30s, and has the highest rate of entrepreneurial activity overall. An older entrepreneur can handle the financial risks, and also tends to have a more stable family life and better experience.
Some successful entrepreneurs who started businesses later in life include Sam Walton (Wal-mart) at age 44, Gordon Bowker (Starbucks) at age 51, Arianna Huffington (Huffington Post) at age 54, and Charles Flint (IBM) at age 61.
Is age just a number? It seems so. Older entrepreneurs are founding more businesses and achieving great things, even in the “Zuckerberg” age.
Original graphic by: SurePayroll


Technology
Visualizing AI Patents by Country
See which countries have been granted the most AI patents each year, from 2012 to 2022.


Visualizing AI Patents by Country
This was originally posted on our Voronoi app. Download the app for free on iOS or Android and discover incredible data-driven charts from a variety of trusted sources.
This infographic shows the number of AI-related patents granted each year from 2010 to 2022 (latest data available). These figures come from the Center for Security and Emerging Technology (CSET), accessed via Stanford University’s 2024 AI Index Report.
From this data, we can see that China first overtook the U.S. in 2013. Since then, the country has seen enormous growth in the number of AI patents granted each year.
| Year | China | EU and UK | U.S. | RoW | Global Total |
|---|---|---|---|---|---|
| 2010 | 307 | 137 | 984 | 571 | 1,999 |
| 2011 | 516 | 129 | 980 | 581 | 2,206 |
| 2012 | 926 | 112 | 950 | 660 | 2,648 |
| 2013 | 1,035 | 91 | 970 | 627 | 2,723 |
| 2014 | 1,278 | 97 | 1,078 | 667 | 3,120 |
| 2015 | 1,721 | 110 | 1,135 | 539 | 3,505 |
| 2016 | 1,621 | 128 | 1,298 | 714 | 3,761 |
| 2017 | 2,428 | 144 | 1,489 | 1,075 | 5,136 |
| 2018 | 4,741 | 155 | 1,674 | 1,574 | 8,144 |
| 2019 | 9,530 | 322 | 3,211 | 2,720 | 15,783 |
| 2020 | 13,071 | 406 | 5,441 | 4,455 | 23,373 |
| 2021 | 21,907 | 623 | 8,219 | 7,519 | 38,268 |
| 2022 | 35,315 | 1,173 | 12,077 | 13,699 | 62,264 |
In 2022, China was granted more patents than every other country combined.
While this suggests that the country is very active in researching the field of artificial intelligence, it doesn’t necessarily mean that China is the farthest in terms of capability.
Key Facts About AI Patents
According to CSET, AI patents relate to mathematical relationships and algorithms, which are considered abstract ideas under patent law. They can also have different meaning, depending on where they are filed.
In the U.S., AI patenting is concentrated amongst large companies including IBM, Microsoft, and Google. On the other hand, AI patenting in China is more distributed across government organizations, universities, and tech firms (e.g. Tencent).
In terms of focus area, China’s patents are typically related to computer vision, a field of AI that enables computers and systems to interpret visual data and inputs. Meanwhile America’s efforts are more evenly distributed across research fields.
Learn More About AI From Visual Capitalist
If you want to see more data visualizations on artificial intelligence, check out this graphic that shows which job departments will be impacted by AI the most.

-

 Markets1 week ago
U.S. Debt Interest Payments Reach $1 Trillion
-

 Business2 weeks ago
Charted: Big Four Market Share by S&P 500 Audits
-

 Real Estate2 weeks ago
Ranked: The Most Valuable Housing Markets in America
-

 Money2 weeks ago
Which States Have the Highest Minimum Wage in America?
-

 AI2 weeks ago
Ranked: Semiconductor Companies by Industry Revenue Share
-

 Markets2 weeks ago
Ranked: The World’s Top Flight Routes, by Revenue
-

 Demographics2 weeks ago
Population Projections: The World’s 6 Largest Countries in 2075
-

 Markets2 weeks ago
The Top 10 States by Real GDP Growth in 2023