Personal Finance
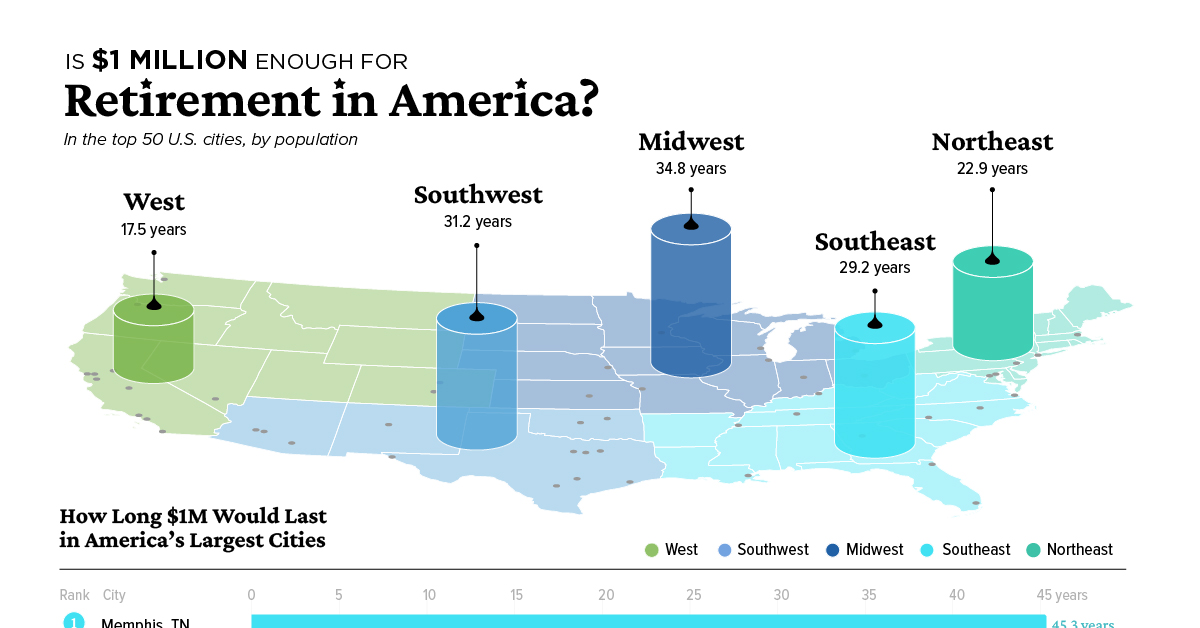
Is $1 Million Enough for Retirement in America?


Is $1 Million Enough for Retirement in America?
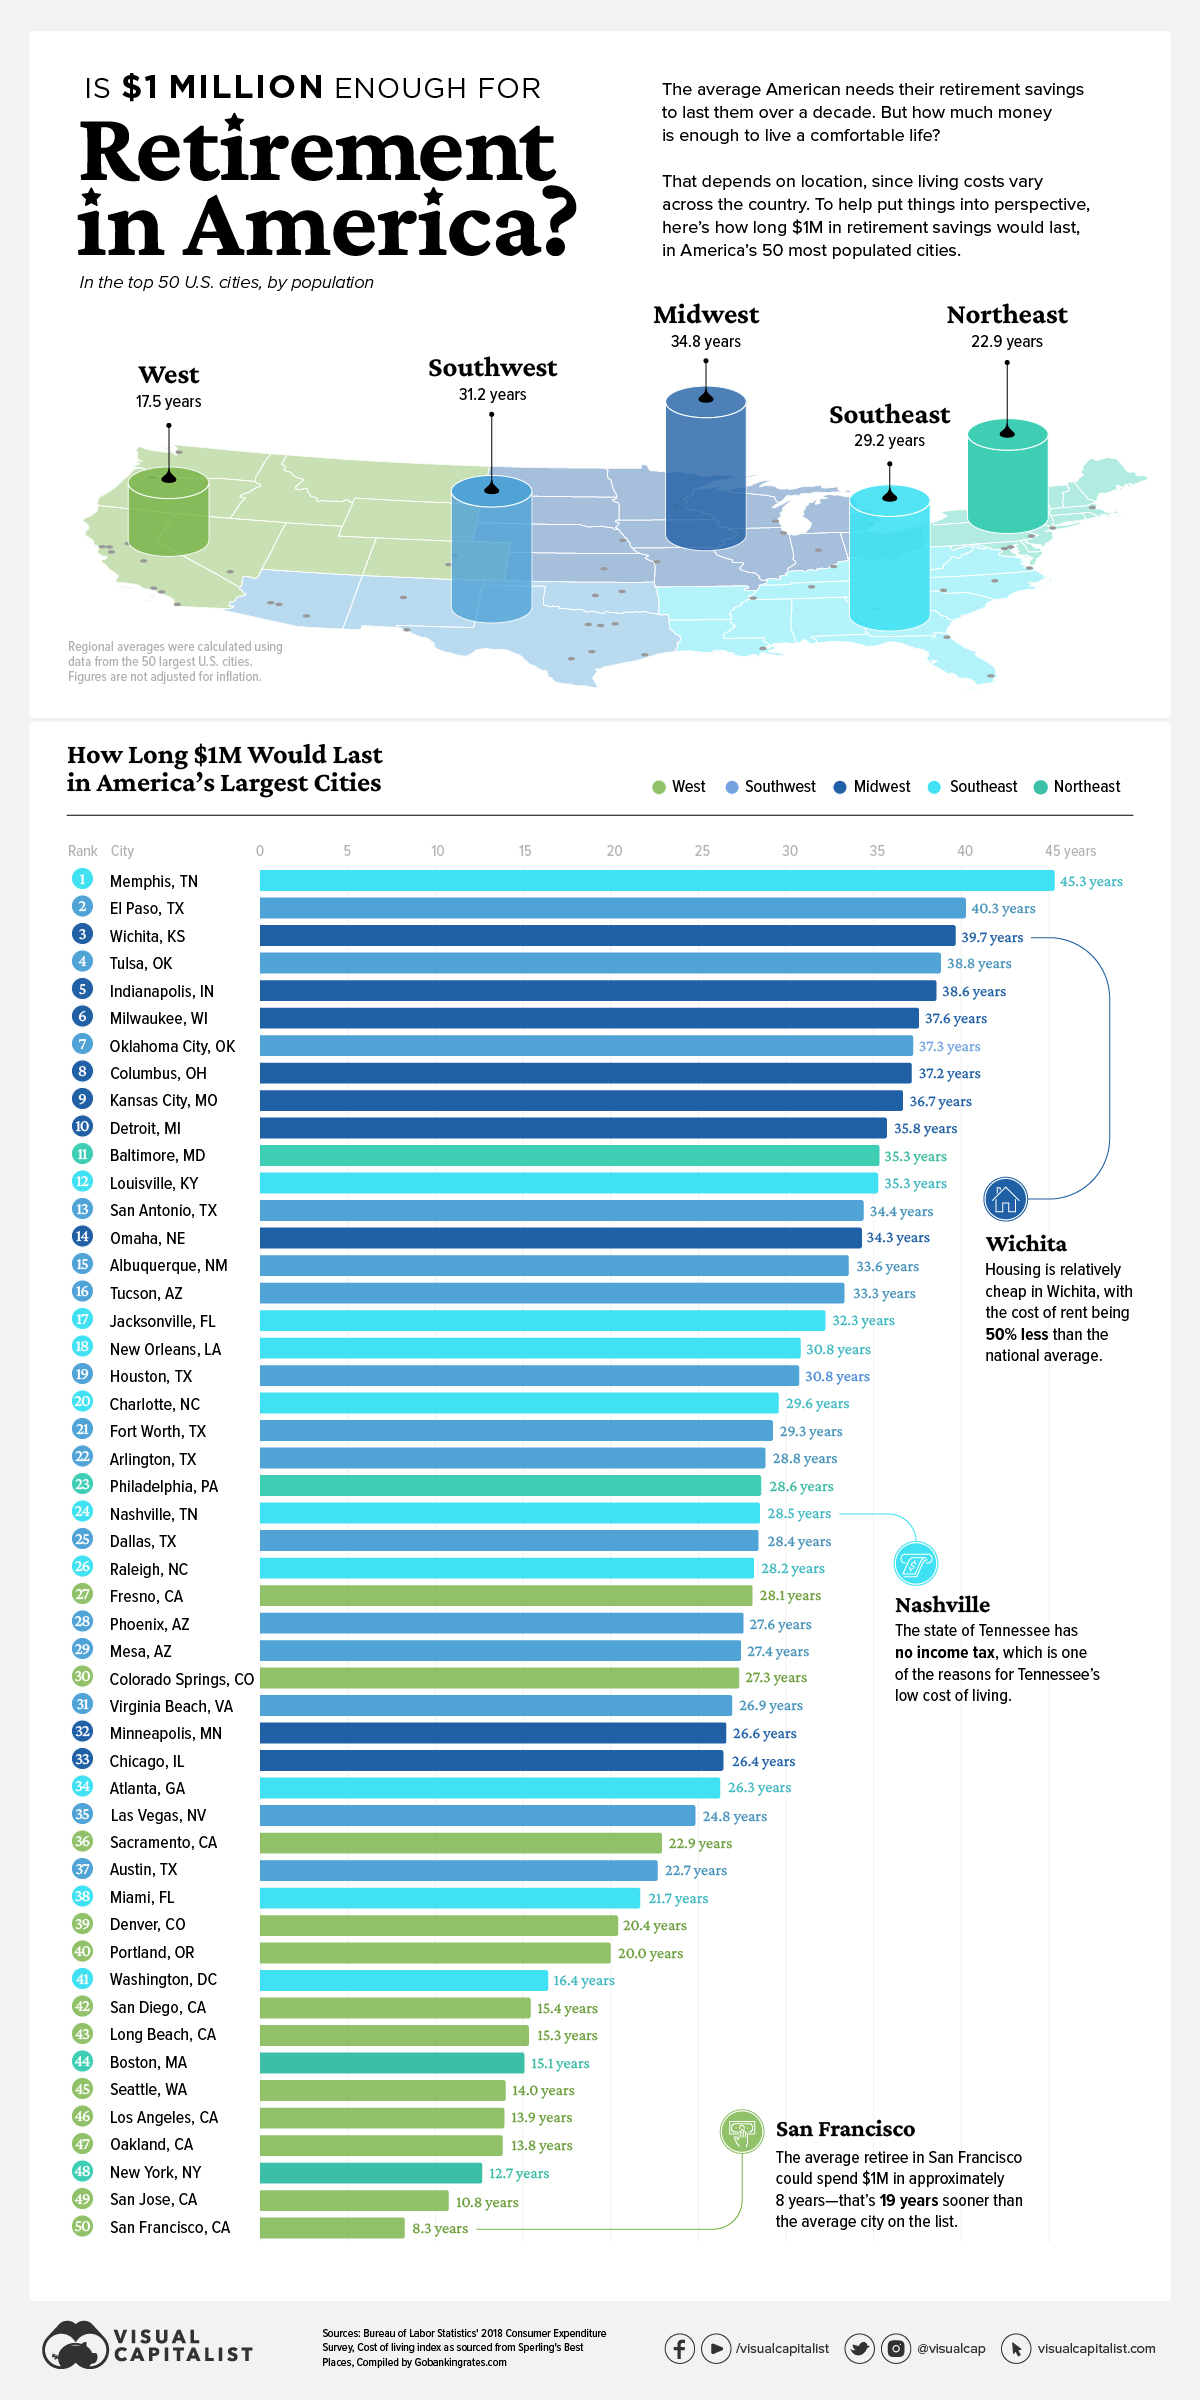
The average American needs their retirement savings to last them 14 to 17 years. With this in mind, is $1 million in savings enough for the average retiree?
Ultimately, it depends on where you live, since the average cost of living varies across the country. This graphic, using data compiled by GOBankingRates.com shows how many years $1 million in retirement savings lasts in the top 50 most populated U.S. cities.
Editor’s note: As one user rightly pointed out, this analysis doesn’t take into account interest earned on the $1 million. With that in consideration, the above calculations could be seen as very conservative figures.
How Long $1 Million Would Last in 50 Cities
To compile this data, GOBankingRates calculated the average expenditures of people aged 65 or older in each city, using data from the Bureau of Labor Statistics and cost-of-living indices from Sperling’s Best Places.
That figure was then reduced to account for average Social Security income. Then, GOBankingRates divided the one million by each city’s final figure to calculate how many years $1 million would last in each place.
Perhaps unsurprisingly, San Francisco, California came in as the most expensive city on the list. $1 million in retirement savings lasts approximately eight years in San Francisco, which is about half the time that the typical American needs their retirement funds to last.
| City | How long $1 would last (years) | Cost-of-living Index | Annual expenditures (after using annual Social Security) |
|---|---|---|---|
| Memphis, TN | 45.3 | 76 | $22,043 |
| El Paso, TX | 40.3 | 81.4 | $24,789 |
| Wichita, KS | 39.7 | 82.1 | $25,145 |
| Tulsa, OK | 38.8 | 83.2 | $25,705 |
| Indianapolis, IN | 38.6 | 83.5 | $25,857 |
| Milwaukee, WI | 37.6 | 84.9 | $26,569 |
| Oklahoma City, OK | 37.3 | 85.4 | $26,824 |
| Columbus, OH | 37.2 | 85.5 | $26,875 |
| Kansas City, MO | 36.7 | 86.2 | $27,231 |
| Detroit, MI | 35.8 | 87.6 | $27,943 |
| Baltimore, MD | 35.3 | 88.2 | $28,248 |
| Louisville, KY | 35.3 | 88.4 | $28,349 |
| San Antonio, TX | 34.4 | 89.7 | $29,011 |
| Omaha, NE | 34.3 | 89.8 | $29,062 |
| Albuquerque, NM | 33.6 | 91.1 | $29,723 |
| Tucson, AZ | 33.3 | 91.6 | $29,977 |
| Jacksonville, FL | 32.3 | 93.5 | $30,943 |
| New Orleans, LA | 30.8 | 96.3 | $32,367 |
| Houston, TX | 30.8 | 96.5 | $32,469 |
| Charlotte, NC | 29.6 | 98.9 | $33,690 |
| Forth Worth, TX | 29.3 | 99.8 | $34,148 |
| Arlington, TX | 28.8 | 100.6 | $34,554 |
| Philadelphia, PA | 28.6 | 101.2 | $34,860 |
| Nashville, TN | 28.5 | 101.4 | $34,961 |
| Dallas, TX | 28.4 | 101.6 | $35,063 |
| Raleigh, NC | 28.2 | 102.3 | $35,419 |
| Fresno, CA | 28.1 | 102.6 | $35,572 |
| Phoenix, AZ | 27.6 | 103.7 | $36,131 |
| Mesa, AZ | 27.4 | 104.2 | $36,385 |
| Colorado Springs, CO | 27.3 | 104.5 | $36,538 |
| Virginia Beach, VA | 26.9 | 105.6 | $37,097 |
| Minneapolis, MN | 26.6 | 106.5 | $37,555 |
| Chicago, IL | 26.4 | 106.9 | $37,759 |
| Atlanta, GA | 26.3 | 107.5 | $38,064 |
| Las Vegas, NV | 24.8 | 111.6 | $40,149 |
| Sacramento, CA | 22.9 | 118.2 | $43,506 |
| Austin, TX | 22.7 | 119.3 | $44,065 |
| Miami, FL | 21.7 | 123.1 | $45,998 |
| Denver, CO | 20.4 | 128.7 | $48,846 |
| Portland, OR | 20.0 | 130.8 | $49,914 |
| Washington, D.C. | 16.4 | 152.1 | $60,747 |
| San Diego, CA | 15.4 | 160.1 | $64,816 |
| Long Beach, CA | 15.3 | 160.4 | $64,969 |
| Boston, MA | 15.1 | 162.4 | $65,986 |
| Seattle. WA | 14.0 | 172.3 | $71,021 |
| Los Angeles, CA | 13.9 | 173.3 | $71,530 |
| Oakland, CA | 13.8 | 174.4 | $72,089 |
| New York, NY | 12.7 | 187.2 | $78,599 |
| San Jose, CA | 10.8 | 214.5 | $92,484 |
| San Francisco, CA | 8.3 | 269.3 | $120,355 |
A big factor in San Francisco’s high cost of living is its housing costs. According to Sperlings Best Places, housing in San Francisco is almost 6x more expensive than the national average and 3.6x more expensive than in the overall state of California.
Four of the top five most expensive cities on the list are in California, with New York City being the only outlier. NYC is the third most expensive city on the ranking, with $1 million expected to last a retiree about 12.7 years.
On the other end of the spectrum, $1 million in retirement would last 45.3 years in Memphis, Tennessee. That’s about 37 years longer than it would last in San Francisco. In Memphis, housing costs are about 2.7x lower than the national average, with other expenses like groceries, health, and utilities well below the national average as well.
Retirement, Who?
Regardless of where you live, it’s helpful to start planning for retirement sooner rather than later. But according to a recent survey, only 41% of women and 58% of men are actively saving for retirement.
However, for some, COVID-19 has been the financial wake-up call they needed to start planning for the future. In fact, in the same survey, 70% of respondents claimed the pandemic has “caused them to pay more attention to their long-term finances.”
This is good news, considering that people are living longer than they used to, meaning their funds need to last longer in general (or people need to retire later in life). Although, as the data in this graphic suggests, where you live will greatly influence how much you actually need.


Personal Finance
Chart: The Declining Value of the U.S. Federal Minimum Wage
This graphic compares the nominal vs. inflation-adjusted value of the U.S. minimum wage, from 1940 to 2023.


The Declining Value of the U.S. Federal Minimum Wage
This was originally posted on our Voronoi app. Download the app for free on iOS or Android and discover incredible data-driven charts from a variety of trusted sources.
This graphic illustrates the history of the U.S. federal minimum wage using data compiled by Statista, in both nominal and real (inflation-adjusted) terms. The federal minimum wage was raised to $7.25 per hour in July 2009, where it has remained ever since.
Nominal vs. Real Value
The data we used to create this graphic can be found in the table below.
| Year | Nominal value ($/hour) | Real value ($/hour) |
|---|---|---|
| 1940 | 0.3 | 6.5 |
| 1945 | 0.4 | 6.82 |
| 1950 | 0.75 | 9.64 |
| 1955 | 0.75 | 8.52 |
| 1960 | 1 | 10.28 |
| 1965 | 1.25 | 12.08 |
| 1970 | 1.6 | 12.61 |
| 1975 | 2.1 | 12.04 |
| 1980 | 3.1 | 11.61 |
| 1985 | 3.35 | 9.51 |
| 1990 | 3.8 | 8.94 |
| 1995 | 4.25 | 8.49 |
| 2000 | 5.15 | 9.12 |
| 2005 | 5.15 | 8.03 |
| 2010 | 7.25 | 10.09 |
| 2015 | 7.25 | 9.3 |
| 2018 | 7.25 | 8.78 |
| 2019 | 7.25 | 8.61 |
| 2020 | 7.25 | 8.58 |
| 2021 | 7.25 | 8.24 |
| 2022 | 7.25 | 7.61 |
| 2023 | 7.25 | 7.25 |
What our graphic shows is how inflation has eroded the real value of the U.S. minimum wage over time, despite nominal increases.
For instance, consider the year 1960, when the federal minimum wage was $1 per hour. After accounting for inflation, this would be worth around $10.28 today!
The two lines converge at 2023 because the nominal and real value are identical in present day terms.
Many States Have Their Own Minimum Wage
According to the National Conference of State Legislatures (NCSL), 30 states and Washington, D.C. have implemented a minimum wage that is higher than $7.25.
The following states have adopted the federal minimum: Georgia, Idaho, Indiana, Iowa, Kansas, Kentucky, New Hampshire, North Carolina, North Dakota, Oklahoma, Pennsylvania, Texas, Utah, Wisconsin, and Wyoming.
Meanwhile, the states of Alabama, Louisiana, Mississippi, South Carolina, and Tennessee have no wage minimums, but have to follow the federal minimum.
How Does the U.S. Minimum Wage Rank Globally?
If you found this topic interesting, check out Mapped: Minimum Wage Around the World to see which countries have the highest minimum wage in monthly terms, as of January 2023.

-

 Markets1 week ago
U.S. Debt Interest Payments Reach $1 Trillion
-

 Markets2 weeks ago
Ranked: The Most Valuable Housing Markets in America
-

 Money2 weeks ago
Which States Have the Highest Minimum Wage in America?
-

 AI2 weeks ago
Ranked: Semiconductor Companies by Industry Revenue Share
-

 Markets2 weeks ago
Ranked: The World’s Top Flight Routes, by Revenue
-

 Countries2 weeks ago
Population Projections: The World’s 6 Largest Countries in 2075
-

 Markets2 weeks ago
The Top 10 States by Real GDP Growth in 2023
-

 Money2 weeks ago
The Smallest Gender Wage Gaps in OECD Countries