Technology
How the Internet of Things is Building Smarter Cities
How the Internet of Things is Building Smart Cities
Urban populations are rising around the world, but cities are struggling to keep up.
As the silent force that has revolutionized our world, technology is now being leveraged to manage rapid urbanization and to create smarter cities.
Today’s infographic from Raconteur explores how the Internet of Things (IoT) has become a vital component in the creation of more efficient, sustainable, and resilient cities, and illustrates the growing impact this will have on both people and the planet.
The Growth of Smart Cities
Since 1950, the amount of people living in cities has risen almost six-fold, from 751 million to over 4 billion in 2018—more than half of the planet’s population. Over the next three decades, cities are projected to add yet another 2.5 billion more people.
This continuing migration to urban areas puts greater pressure on public services as well as urban planning. As a result, cities are implementing solutions driven by technology and data to reduce the added strain created by this growth.
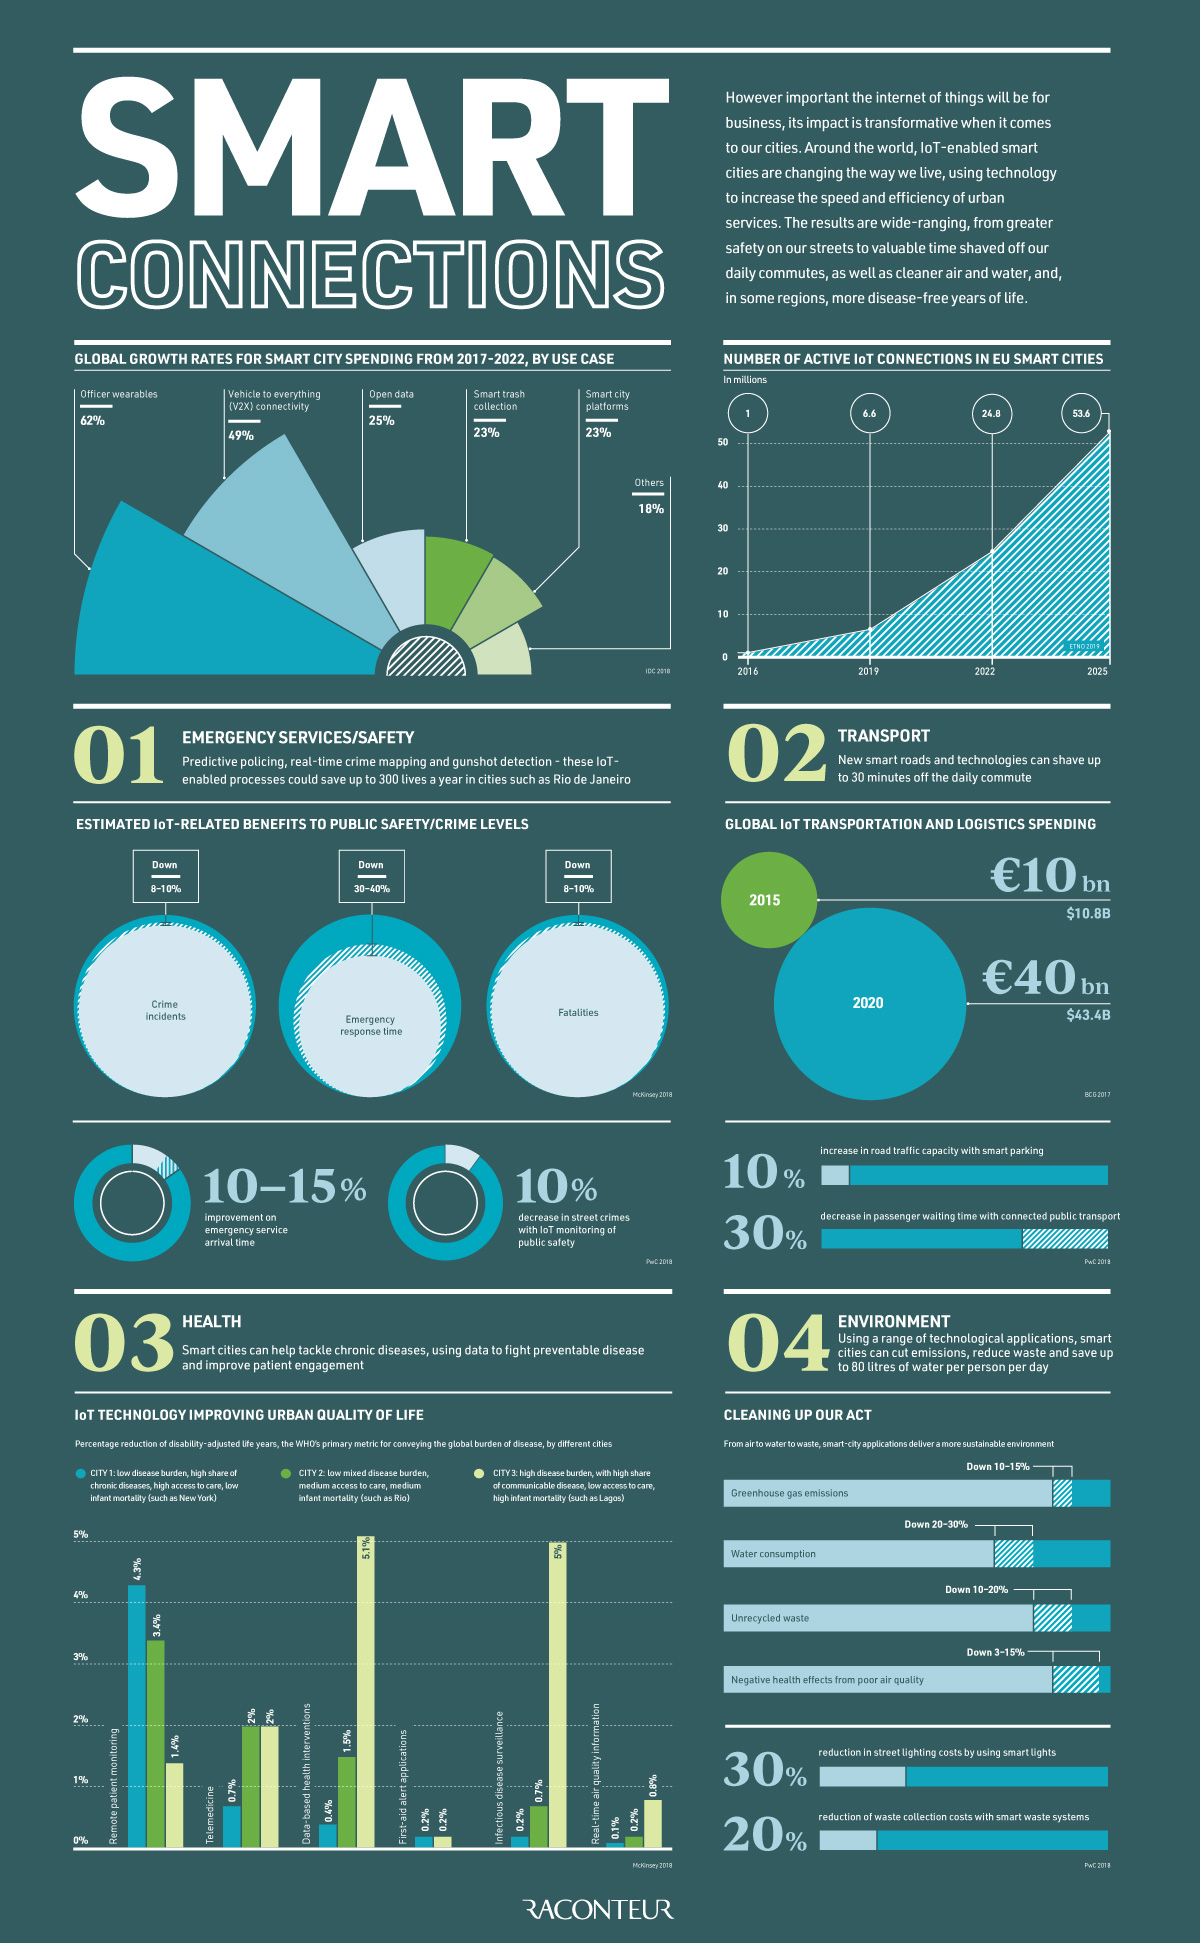
Smart City Innovations
With spending on smart city development to reach $158 billion by 2022, significant growth is expected from emerging innovations such as:
- Officer wearables:
Devices that equip police officers with real-time information to improve awareness and make better decisions
Global CAGR (2017-2022): 62% - Vehicle to everything (V2X) connectivity:
Allows cars to communicate with other cars, transport infrastructure, and pedestrians
Global CAGR (2017-2022): 49% - Open data:
Data that anyone can access that contributes to the transparency of government and smart city initiatives
Global CAGR (2017-2022): 25% - Smart trash collection:
Solar powered, sensor-equipped smart bins allow waste collectors to track waste levels and optimize their fuel usage
Global CAGR (2017-2022): 23% - Smart city platforms:
Systems that collect data from different areas such as pollution levels and traffic density to better manage smart cities
Global CAGR (2017-2022): 23%
These technologies could lead to a wide-range of transformative effects for cities that are willing to embrace them.
Measuring the Impact
Smart city technologies have the power to improve the health and well-being of citizens, while also providing new avenues for economic development.
Safety
To enhance public safety, cities are adopting real-time crime mapping, gunshot detection, and predictive policing tools to help identify potential hotspots and prevent crimes from happening.
According to McKinsey, tapping into these technologies could reduce crime rates and fatalities by 8-10%, potentially saving up to 300 lives each year in cities with a population size and crime rate similar to Rio de Janeiro.
Transport
As more vehicles join the IoT ecosystem, the bigger the IoT logistics and transportation industry grows, with spending estimated to reach over $43 billion by the end of this year.
New innovations like smart roads that support automated vehicles are beginning to get more investment from cities. These roads will be able to communicate with automated vehicles to ensure the safety of drivers, and better optimize traffic—potentially decreasing the average commute time by 30 minutes.
Health
Technology is providing new strategies for the prevention and treatment of chronic diseases.
In China, drones with facial recognition technology are being used to track those affected with coronavirus to ensure they do not break quarantine and risk spreading the virus.
The most effective use of technology however, is data-based health interventions for maternal and child health, which rely on the use of analytics to identity new mothers and to direct prenatal and postnatal educational campaigns to them. Using interventions to prevent diseases before they occur has proven to be particularly effective in cities with a high disease burden and low access to care, such as Lagos in Nigeria.
These new technologies are reducing cities’ burden of chronic disease. This is measured across the WHO’s central metric disability-adjusted life years (DALY), which is equal to one year of “healthy” life lost due to contracting a disease. For example, using data-based interventions for maternal care could reduce DALYs by more than 5%.
Environment
While a significant portion of greenhouse gas emissions come from cities, these can be cut by up to 15% with smart city solutions by reducing electricity and heat production.
Smart cities will also play a pivotal role in reducing water consumption. Applications such as smart irrigation systems, water leakage, and quality and consumption monitoring could save a city between 25-80 liters of water per person, per day.
Citizen-Led Smart Cities
The growing uptake of 5G can help fuel these economic and social benefits. With its high-speed connectivity and ability to support more devices, 5G could empower smart cities to scale—making it a defining feature in the next generation of innovative smart city projects. However, this is not the only model that can be leveraged.
Some newer iterations of smart cities are grounded in the principles of equity and social inclusion. For instance, Vienna regularly tops the Smart Cities Index for its inclusive and collaborative way of approaching smart city initiatives. The city advocates for socially-balanced solutions that consider citizens from all socio-economic backgrounds and age groups.
Vienna is just one of many European hubs that are leading the way in the sheer volume of smart city project investments. In fact, the continent is expected to have as many as 53 million active IoT connections by 2025.
While every city has a different strategy, citizens will prove to be their most important asset. With a flurry of exciting new smart city applications becoming the new normal over the next decade, it is clear that humans will be at the heart of actualizing their true potential.


Technology
Visualizing AI Patents by Country
See which countries have been granted the most AI patents each year, from 2012 to 2022.


Visualizing AI Patents by Country
This was originally posted on our Voronoi app. Download the app for free on iOS or Android and discover incredible data-driven charts from a variety of trusted sources.
This infographic shows the number of AI-related patents granted each year from 2010 to 2022 (latest data available). These figures come from the Center for Security and Emerging Technology (CSET), accessed via Stanford University’s 2024 AI Index Report.
From this data, we can see that China first overtook the U.S. in 2013. Since then, the country has seen enormous growth in the number of AI patents granted each year.
| Year | China | EU and UK | U.S. | RoW | Global Total |
|---|---|---|---|---|---|
| 2010 | 307 | 137 | 984 | 571 | 1,999 |
| 2011 | 516 | 129 | 980 | 581 | 2,206 |
| 2012 | 926 | 112 | 950 | 660 | 2,648 |
| 2013 | 1,035 | 91 | 970 | 627 | 2,723 |
| 2014 | 1,278 | 97 | 1,078 | 667 | 3,120 |
| 2015 | 1,721 | 110 | 1,135 | 539 | 3,505 |
| 2016 | 1,621 | 128 | 1,298 | 714 | 3,761 |
| 2017 | 2,428 | 144 | 1,489 | 1,075 | 5,136 |
| 2018 | 4,741 | 155 | 1,674 | 1,574 | 8,144 |
| 2019 | 9,530 | 322 | 3,211 | 2,720 | 15,783 |
| 2020 | 13,071 | 406 | 5,441 | 4,455 | 23,373 |
| 2021 | 21,907 | 623 | 8,219 | 7,519 | 38,268 |
| 2022 | 35,315 | 1,173 | 12,077 | 13,699 | 62,264 |
In 2022, China was granted more patents than every other country combined.
While this suggests that the country is very active in researching the field of artificial intelligence, it doesn’t necessarily mean that China is the farthest in terms of capability.
Key Facts About AI Patents
According to CSET, AI patents relate to mathematical relationships and algorithms, which are considered abstract ideas under patent law. They can also have different meaning, depending on where they are filed.
In the U.S., AI patenting is concentrated amongst large companies including IBM, Microsoft, and Google. On the other hand, AI patenting in China is more distributed across government organizations, universities, and tech firms (e.g. Tencent).
In terms of focus area, China’s patents are typically related to computer vision, a field of AI that enables computers and systems to interpret visual data and inputs. Meanwhile America’s efforts are more evenly distributed across research fields.
Learn More About AI From Visual Capitalist
If you want to see more data visualizations on artificial intelligence, check out this graphic that shows which job departments will be impacted by AI the most.

-

 Markets1 week ago
U.S. Debt Interest Payments Reach $1 Trillion
-

 Business2 weeks ago
Charted: Big Four Market Share by S&P 500 Audits
-

 Real Estate2 weeks ago
Ranked: The Most Valuable Housing Markets in America
-

 Money2 weeks ago
Which States Have the Highest Minimum Wage in America?
-

 AI2 weeks ago
Ranked: Semiconductor Companies by Industry Revenue Share
-

 Markets2 weeks ago
Ranked: The World’s Top Flight Routes, by Revenue
-

 Demographics2 weeks ago
Population Projections: The World’s 6 Largest Countries in 2075
-

 Markets2 weeks ago
The Top 10 States by Real GDP Growth in 2023