Mining
Why Investors Go to Copper as an Inflation Hedge
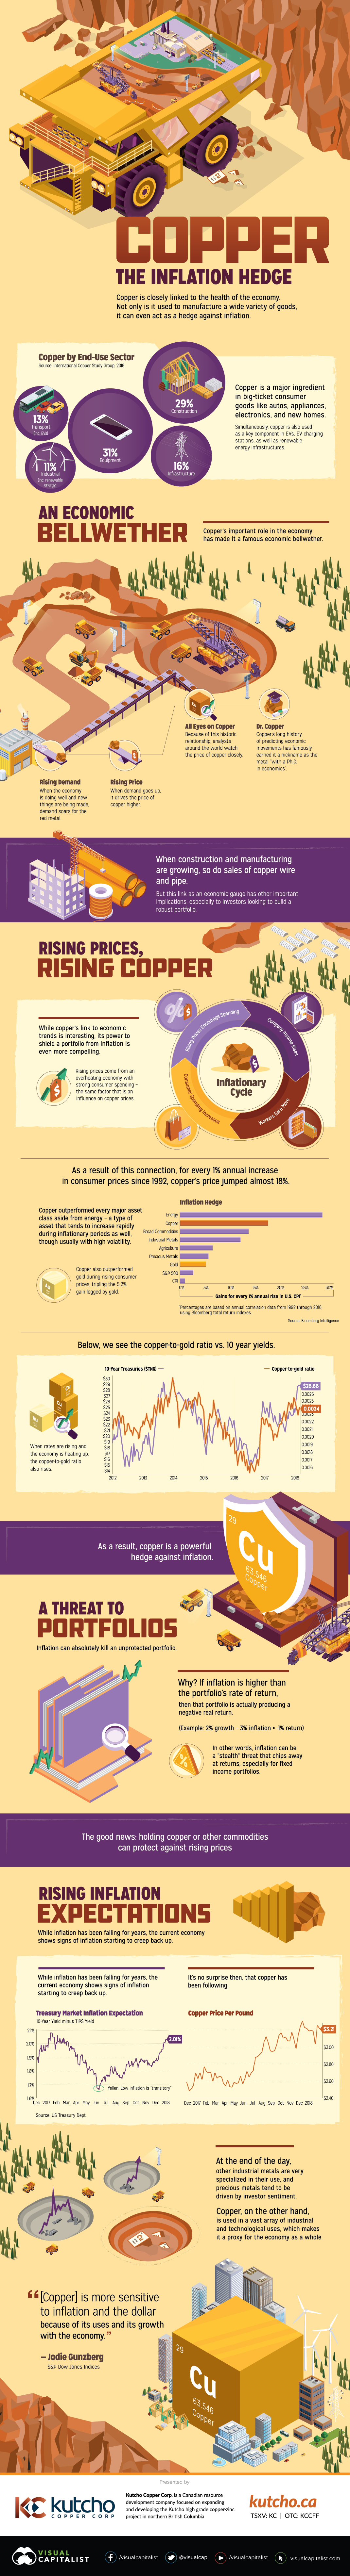
Why Investors Turn to Copper as an Inflation Hedge
Every year, a vast amount of copper is used by the global economy to manufacture a wide variety of goods.
It’s a major ingredient in big-ticket consumer goods like autos, appliances, electronics, and new homes. Simultaneously, copper is also gobbled up for many industrial uses including telecommunications, utilities, construction, and industrial machinery.
An Economic Bellwether
Today’s infographic comes to us from Kutcho Copper, and it shows the red metal’s important role in the economy, as well as why it has become a famous economic bellwether.
Rising Demand
When the economy is doing well and new things are being made, demand soars for the red metal.
Rising Price
When demand goes up, it drives the price of copper higher.
All Eyes on Copper
Because of this historic relationship, analysts around the world watch the price of copper closely.
Dr. Copper
Copper’s long history of predicting economic movements has famously earned it a nickname as the metal “with a Ph.D. in economics”
In other words: when construction and manufacturing are growing, so do sales of copper products. But this link as an economic gauge has other important implications, especially to investors looking to build a robust portfolio.
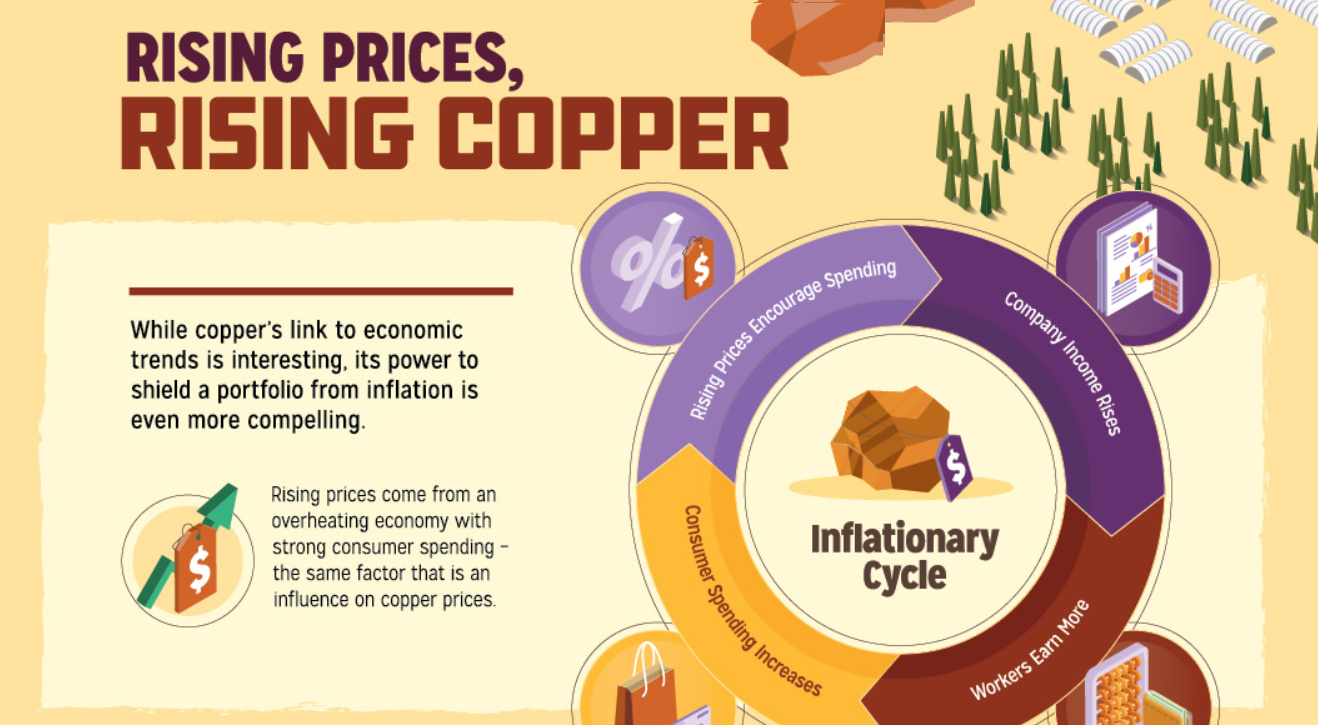
Rising Prices, Rising Copper
While copper’s link to economic trends is interesting, it’s power to shield a portfolio from inflation is even more compelling.
Rising prices come from an overheating economy with strong consumer spending – the same factor that is an influence on copper prices. As a result of this connection, tor every 1% annual increase in consumer prices since 1992, copper’s price jumped almost 18%.
In an analysis by Bloomberg Intelligence, copper outperformed every major asset class aside from energy as an inflation hedge – and during periods of rising consumer prices, copper had triple the 5.2% gain logged by gold.
A Threat to Portfolios
Inflation can absolutely kill an unprotected portfolio.
Why? If inflation is higher than the portfolio’s rate of return, then that portfolio is actually producing a negative real return. (Example: 2% growth – 3% inflation = -1% return)
In other words, inflation can be a “stealth” threat that chips away at returns, especially for fixed income portfolios. The good news: holding copper or other commodities can protect against rising prices.
Copper: The Inflation Hedge
At the end of the day, other industrial metals are very specialized in their use, and precious metals tend to be driven by investor sentiment.
Copper, on the other hand, is used in a vast array of industrial and technological uses, which makes it a proxy for the economy as a whole.
Copper is more sensitive to inflation and the dollar because of its uses and its growth with the economy.
– Jodie Gunzberg, S&P Dow Jones Indices


Lithium
Ranked: The Top 10 EV Battery Manufacturers in 2023
Asia dominates this ranking of the world’s largest EV battery manufacturers in 2023.


The Top 10 EV Battery Manufacturers in 2023
This was originally posted on our Voronoi app. Download the app for free on iOS or Android and discover incredible data-driven charts from a variety of trusted sources.
Despite efforts from the U.S. and EU to secure local domestic supply, all major EV battery manufacturers remain based in Asia.
In this graphic we rank the top 10 EV battery manufacturers by total battery deployment (measured in megawatt-hours) in 2023. The data is from EV Volumes.
Chinese Dominance
Contemporary Amperex Technology Co. Limited (CATL) has swiftly risen in less than a decade to claim the title of the largest global battery group.
The Chinese company now has a 34% share of the market and supplies batteries to a range of made-in-China vehicles, including the Tesla Model Y, SAIC’s MG4/Mulan, and various Li Auto models.
| Company | Country | 2023 Production (megawatt-hour) | Share of Total Production |
|---|---|---|---|
| CATL | 🇨🇳 China | 242,700 | 34% |
| BYD | 🇨🇳 China | 115,917 | 16% |
| LG Energy Solution | 🇰🇷 Korea | 108,487 | 15% |
| Panasonic | 🇯🇵 Japan | 56,560 | 8% |
| SK On | 🇰🇷 Korea | 40,711 | 6% |
| Samsung SDI | 🇰🇷 Korea | 35,703 | 5% |
| CALB | 🇨🇳 China | 23,493 | 3% |
| Farasis Energy | 🇨🇳 China | 16,527 | 2% |
| Envision AESC | 🇨🇳 China | 8,342 | 1% |
| Sunwoda | 🇨🇳 China | 6,979 | 1% |
| Other | - | 56,040 | 8% |
In 2023, BYD surpassed LG Energy Solution to claim second place. This was driven by demand from its own models and growth in third-party deals, including providing batteries for the made-in-Germany Tesla Model Y, Toyota bZ3, Changan UNI-V, Venucia V-Online, as well as several Haval and FAW models.
The top three battery makers (CATL, BYD, LG) collectively account for two-thirds (66%) of total battery deployment.
Once a leader in the EV battery business, Panasonic now holds the fourth position with an 8% market share, down from 9% last year. With its main client, Tesla, now sourcing batteries from multiple suppliers, the Japanese battery maker seems to be losing its competitive edge in the industry.
Overall, the global EV battery market size is projected to grow from $49 billion in 2022 to $98 billion by 2029, according to Fortune Business Insights.

-

 Mining1 week ago
Gold vs. S&P 500: Which Has Grown More Over Five Years?
-

 Markets2 weeks ago
Ranked: The Most Valuable Housing Markets in America
-

 Money2 weeks ago
Which States Have the Highest Minimum Wage in America?
-

 AI2 weeks ago
Ranked: Semiconductor Companies by Industry Revenue Share
-

 Markets2 weeks ago
Ranked: The World’s Top Flight Routes, by Revenue
-

 Countries2 weeks ago
Population Projections: The World’s 6 Largest Countries in 2075
-

 Markets2 weeks ago
The Top 10 States by Real GDP Growth in 2023
-

 Demographics2 weeks ago
The Smallest Gender Wage Gaps in OECD Countries