Markets
Investing Megatrend: How Rapid Urbanization is Shaping the Future

How Rapid Urbanization is Shaping the Future
The world is constantly changing, and many of these shifts have the potential to alter the investment landscape.
While some of these changes can be temporary and fleeting, others can be powerful, transformative “megatrends” that shape how society is organized at a fundamental level.
One such megatrend that has been in place for decades is the rapid rate of population growth in urban areas — and while it’s been highly influential thus far, we’ve likely only seen the beginning of its formative impact on the global economy.
An Intro to Rapid Urbanization
Today’s infographic comes to us from iShares by BlackRock, and it highlights the case for rapid urbanization as being one of the most important overarching trends to watch in markets over the long term.
It’s a trend that originated in developed economies in the 21st century, as people transitioned from agricultural work to factory and service jobs.
| Region | Urban share of population (1900) | Urban share of population (2016) |
|---|---|---|
| United States | 40% | 82% |
| Japan | 12% | 91% |
| Western Europe | 41% | 80% |
In these developed economies today, cities are major sources of innovation and wealth creation, and the World Bank estimates that over 80% of global GDP is now generated in cities.
A Global Shift
Over the coming decades, the large-scale role of cities will become even more amplified as rapid urbanization spills over to the rest of the world.
Billions of people — especially in Asia and Africa — will be seeking opportunities in cities over the coming decades. Between 2018 and 2050, the global urban population will increase from 55% to 68%, adding another 2.5 billion people to cities around the world.
| Rank | Country | Urban population growth (2018-2050) |
|---|---|---|
| #1 | India | 416 million people |
| #2 | China | 255 million people |
| #3 | Nigeria | 189 million people |
Nearly 90% of this growth will be in Africa and Asia, with India alone adding 416 million new people to its cities — more than any other country in the world over this timeframe.
The Dawn of the Megacity
People are not only flocking to cities, they are flocking to megacities — urban conglomerations with more than 10 million people.
In just 40 years, the total amount of megacities will quadruple, gaining nearly 600 million residents in the process:
| Year | # of Megacities | Population | % of Urban Population |
|---|---|---|---|
| 1990 | 10 | 153 million | 7% |
| 2010 | 23 | 370 million | 12% |
| 2030 | 41 | 730 million | 14% |
With billions of new people living in urban areas — and many of them living in megacities — we will have to rethink how our cities are designed and engineered.
And as this happens, the city as we know it will be revolutionized.
The Urban Opportunity
Rapid urbanization will create both opportunities and challenges for society, and a plethora of investment possibilities in the process.
As global cities become more integrated with technology, new business models will emerge as cities become smarter, denser, and more connected.
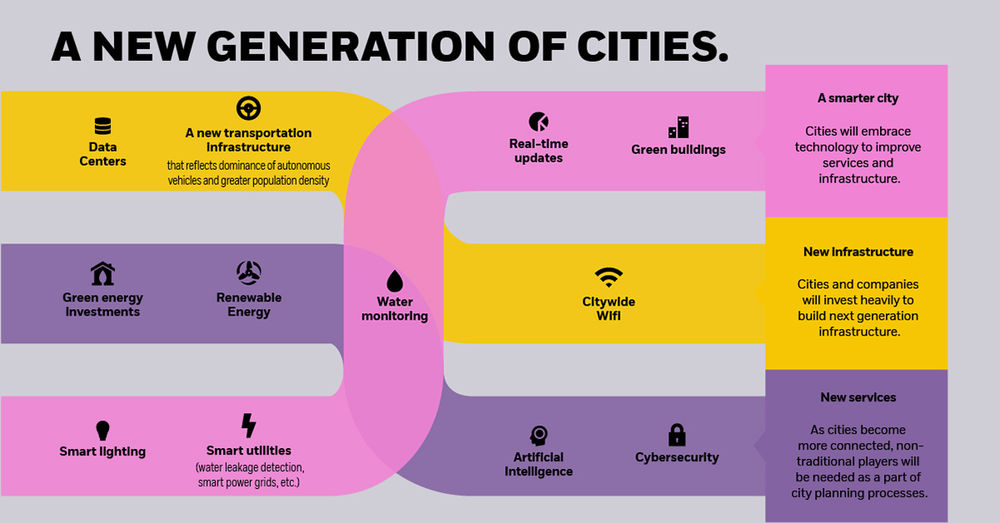
These potential opportunities include:
- Smarter cities
Cities will embrace technology to improve services and infrastructure, adding tech-driven features like smart lighting or real-time traffic updates. - New infrastructure
Cities and companies will invest heavily to build next generation infrastructure, such as data centers, green energy, and citywide WiFi. - A focus on personal security
With higher crime rates in cities than rural areas, governments will employ elevated levels of surveillance on citizens in cities. Increasing connectivity means that every activity is logged and monitored. - New services
As cities become more connected, non-traditional players — such as cybersecurity experts or cleantech engineers — will be needed as a part of city planning processes. - No car ownership
A lack of space and the rise of autonomous cars will mean fewer people will own a car, preferring to use ‘summon-able’ services instead. - New healthcare systems
As population density grows to unprecedented levels, existing healthcare systems will need to be radically overhauled to deal with this influx.
Rapid urbanization will have a wide-ranging impact on global economics, demographics, and society as a whole.
As rapid urbanization and other megatrends collide and feed off each other, there’s no doubt that even more thematic investment opportunities will be created.


Markets
U.S. Debt Interest Payments Reach $1 Trillion
U.S. debt interest payments have surged past the $1 trillion dollar mark, amid high interest rates and an ever-expanding debt burden.


U.S. Debt Interest Payments Reach $1 Trillion
This was originally posted on our Voronoi app. Download the app for free on iOS or Android and discover incredible data-driven charts from a variety of trusted sources.
The cost of paying for America’s national debt crossed the $1 trillion dollar mark in 2023, driven by high interest rates and a record $34 trillion mountain of debt.
Over the last decade, U.S. debt interest payments have more than doubled amid vast government spending during the pandemic crisis. As debt payments continue to soar, the Congressional Budget Office (CBO) reported that debt servicing costs surpassed defense spending for the first time ever this year.
This graphic shows the sharp rise in U.S. debt payments, based on data from the Federal Reserve.
A $1 Trillion Interest Bill, and Growing
Below, we show how U.S. debt interest payments have risen at a faster pace than at another time in modern history:
| Date | Interest Payments | U.S. National Debt |
|---|---|---|
| 2023 | $1.0T | $34.0T |
| 2022 | $830B | $31.4T |
| 2021 | $612B | $29.6T |
| 2020 | $518B | $27.7T |
| 2019 | $564B | $23.2T |
| 2018 | $571B | $22.0T |
| 2017 | $493B | $20.5T |
| 2016 | $460B | $20.0T |
| 2015 | $435B | $18.9T |
| 2014 | $442B | $18.1T |
| 2013 | $425B | $17.2T |
| 2012 | $417B | $16.4T |
| 2011 | $433B | $15.2T |
| 2010 | $400B | $14.0T |
| 2009 | $354B | $12.3T |
| 2008 | $380B | $10.7T |
| 2007 | $414B | $9.2T |
| 2006 | $387B | $8.7T |
| 2005 | $355B | $8.2T |
| 2004 | $318B | $7.6T |
| 2003 | $294B | $7.0T |
| 2002 | $298B | $6.4T |
| 2001 | $318B | $5.9T |
| 2000 | $353B | $5.7T |
| 1999 | $353B | $5.8T |
| 1998 | $360B | $5.6T |
| 1997 | $368B | $5.5T |
| 1996 | $362B | $5.3T |
| 1995 | $357B | $5.0T |
| 1994 | $334B | $4.8T |
| 1993 | $311B | $4.5T |
| 1992 | $306B | $4.2T |
| 1991 | $308B | $3.8T |
| 1990 | $298B | $3.4T |
| 1989 | $275B | $3.0T |
| 1988 | $254B | $2.7T |
| 1987 | $240B | $2.4T |
| 1986 | $225B | $2.2T |
| 1985 | $219B | $1.9T |
| 1984 | $205B | $1.7T |
| 1983 | $176B | $1.4T |
| 1982 | $157B | $1.2T |
| 1981 | $142B | $1.0T |
| 1980 | $113B | $930.2B |
| 1979 | $96B | $845.1B |
| 1978 | $84B | $789.2B |
| 1977 | $69B | $718.9B |
| 1976 | $61B | $653.5B |
| 1975 | $55B | $576.6B |
| 1974 | $50B | $492.7B |
| 1973 | $45B | $469.1B |
| 1972 | $39B | $448.5B |
| 1971 | $36B | $424.1B |
| 1970 | $35B | $389.2B |
| 1969 | $30B | $368.2B |
| 1968 | $25B | $358.0B |
| 1967 | $23B | $344.7B |
| 1966 | $21B | $329.3B |
Interest payments represent seasonally adjusted annual rate at the end of Q4.
At current rates, the U.S. national debt is growing by a remarkable $1 trillion about every 100 days, equal to roughly $3.6 trillion per year.
As the national debt has ballooned, debt payments even exceeded Medicaid outlays in 2023—one of the government’s largest expenditures. On average, the U.S. spent more than $2 billion per day on interest costs last year. Going further, the U.S. government is projected to spend a historic $12.4 trillion on interest payments over the next decade, averaging about $37,100 per American.
Exacerbating matters is that the U.S. is running a steep deficit, which stood at $1.1 trillion for the first six months of fiscal 2024. This has accelerated due to the 43% increase in debt servicing costs along with a $31 billion dollar increase in defense spending from a year earlier. Additionally, a $30 billion increase in funding for the Federal Deposit Insurance Corporation in light of the regional banking crisis last year was a major contributor to the deficit increase.
Overall, the CBO forecasts that roughly 75% of the federal deficit’s increase will be due to interest costs by 2034.

-

 Mining2 weeks ago
Charted: The Value Gap Between the Gold Price and Gold Miners
-

 Real Estate1 week ago
Ranked: The Most Valuable Housing Markets in America
-

 Business1 week ago
Charted: Big Four Market Share by S&P 500 Audits
-

 AI1 week ago
The Stock Performance of U.S. Chipmakers So Far in 2024
-

 Automotive1 week ago
Almost Every EV Stock is Down After Q1 2024
-

 Money2 weeks ago
Where Does One U.S. Tax Dollar Go?
-

 Green2 weeks ago
Ranked: Top Countries by Total Forest Loss Since 2001
-

 Markets2 weeks ago
Visualizing America’s Shortage of Affordable Homes