Demographics
An Investing Megatrend: How Demographics and Social Changes are Shaping the Future
For millennia, people have found support and community through defining factors, ranging from age and race to income and education levels.
However, these characteristics are not static—and drastic demographic changes are starting to create powerful ripple effects in the 21st-century economy.
The Impact of Demographics and Social Changes
Today’s infographic from BlackRock delves into the significant impact that demographics and human rights movements have on global markets. Of the five megatrends explored in this series, demographics are predicted to have the farthest-reaching impact.

What are Demographics?
Demographics are the characteristics of populations that change over time. These include:
- Age
- Gender
- Race
- Birth and death rates
- Education levels
- Income levels
- Average family size
As a result, major demographic trends offer both unique challenges and opportunities for businesses, societies, and investors.
The Biggest Shifts
What are the biggest shifts in demographics that the world faces today?
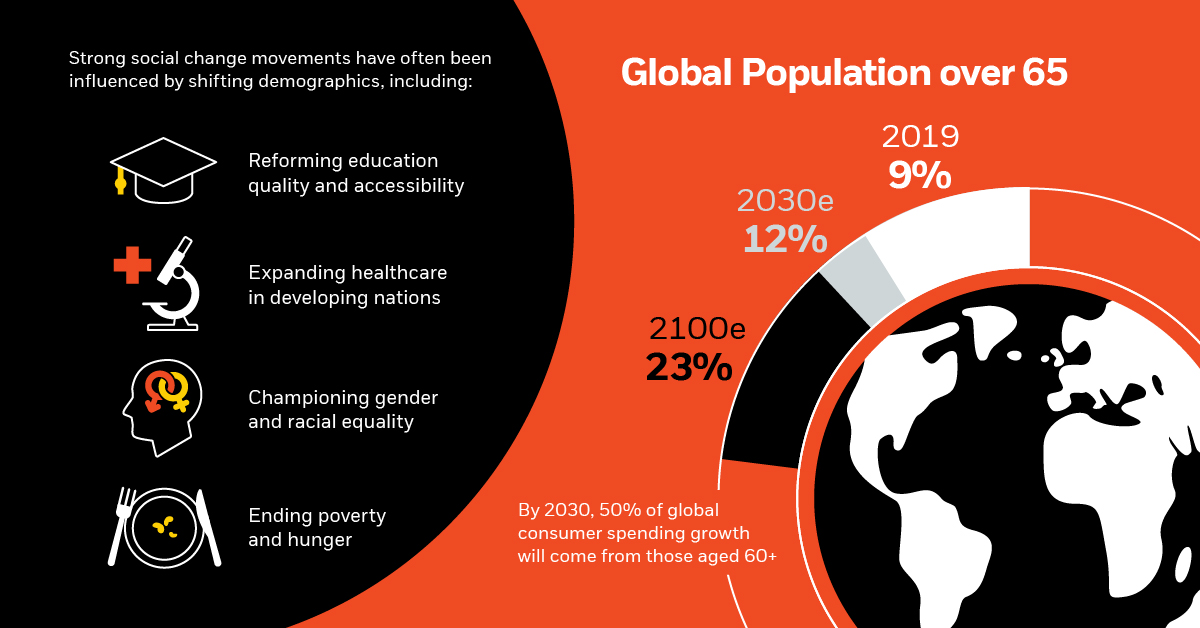
1. Aging Population
The global population is aging rapidly─as fertility rates decline worldwide, those in the 65 years and older age bracket are steadily increasing in numbers.
2. Future Workforce
As the population continues to age, fewer people are available to sustain the working population. For the first time in recorded history, the number of people in developed nations between 20 to 64 years old is expected to shrink in 2020.
3. Immigration Increase
Immigration has been steadily increasing since the turn of the 21st century. Primary migration factors range from the serious (political turmoil) to the hopeful (better job offers).
In particular, areas such as Asia and Europe see much higher movement than others, causing a strain on resources in those regions.
4. Consumer Spending
A steadily aging population is slowly shifting the purchasing power to older households. In Japan, for example, half of all current household spending comes from people over 60, compared with 13% of spending from people under 40.
How Does Social Change Play a Part?
Demographics are the characteristics of people that change over time, whereas social change is the evolution of people’s behaviours or cultural norms over time.
Strong social change movements have often been influenced by demographic changes, including:
- Ending poverty and hunger
- Expanding healthcare in developing nations
- Reforming education quality and accessibility
- Championing gender and racial equality
Examples of major human rights movements include creating stronger environmental policies and securing women’s right to vote.
Opportunities for Investors
These changes pose some exciting opportunities for investors, both now and in the near future.
Healthcare
Global healthcare spending is predicted to grow from US$7.7 trillion in 2017 to over US$10 trillion in 2022. To meet the demands of age-related illnesses, companies will need solutions that offer quality care at much lower costs—for patients and an overburdened healthcare system.
Changing Workforce
With a declining working population, adapting a workforce’s skill set may be the key to keeping economies afloat.
As automation becomes commonplace, workers will need to develop more advanced skills to stay competitive. Newer economies will need to ensure that automation supports a shrinking workforce, without restricting job and wage growth.
Education Reform
By 2100, over 50% of the world will be living in either India, China, or Africa.
Global policy leadership and sales of education goods and services will be shaped less by issues and needs in the U.S., and more by the issues and needs of Africa, South Asia, and China.
—Shannon May, CoFounder of Bridge International Academies
In the future, education and training in these growing regions will be based on skills relevant to the modern workforce and shifting global demographics.
Consumer Behaviour
Spending power will continue to migrate to older populations. Global consumer spending from those over 60 years is predicted to nearly double, from US$8 trillion in 2010 to a whopping US$15 trillion in 2020.
Investing Megatrends
Demographics and social changes are the undercurrents of many economic, cultural, and business decisions. They underpin all other megatrends and will significantly influence how the world evolves.
As demographics shift over time, we will see the priorities of economies shift as well─and these changes will continue to offer new opportunities for investors to make an impact for the future of a global society.


Demographics
The Countries That Have Become Sadder Since 2010
Tracking Gallup survey data for more than a decade reveals some countries are witnessing big happiness declines, reflecting their shifting socio-economic conditions.


The Countries That Have Become Sadder Since 2010
This was originally posted on our Voronoi app. Download the app for free on iOS or Android and discover incredible data-driven charts from a variety of trusted sources.
Can happiness be quantified?
Some approaches that try to answer this question make a distinction between two differing components of happiness: a daily experience part, and a more general life evaluation (which includes how people think about their life as a whole).
The World Happiness Report—first launched in 2012—has been making a serious go at quantifying happiness, by examining Gallup poll data that asks respondents in nearly every country to evaluate their life on a 0–10 scale. From this they extrapolate a single “happiness score” out of 10 to compare how happy (or unhappy) countries are.
More than a decade later, the 2024 World Happiness Report continues the mission. Its latest findings also include how some countries have become sadder in the intervening years.
Which Countries Have Become Unhappier Since 2010?
Afghanistan is the unhappiest country in the world right now, and is also 60% unhappier than over a decade ago, indicating how much life has worsened since 2010.
In 2021, the Taliban officially returned to power in Afghanistan, after nearly two decades of American occupation in the country. The Islamic fundamentalist group has made life harder, especially for women, who are restricted from pursuing higher education, travel, and work.
On a broader scale, the Afghan economy has suffered post-Taliban takeover, with various consequent effects: mass unemployment, a drop in income, malnutrition, and a crumbling healthcare system.
| Rank | Country | Happiness Score Loss (2010–24) | 2024 Happiness Score (out of 10) |
|---|---|---|---|
| 1 | 🇦🇫 Afghanistan | -2.6 | 1.7 |
| 2 | 🇱🇧 Lebanon | -2.3 | 2.7 |
| 3 | 🇯🇴 Jordan | -1.5 | 4.2 |
| 4 | 🇻🇪 Venezuela | -1.3 | 5.6 |
| 5 | 🇲🇼 Malawi | -1.2 | 3.4 |
| 6 | 🇿🇲 Zambia | -1.2 | 3.5 |
| 7 | 🇧🇼 Botswana | -1.2 | 3.4 |
| 8 | 🇾🇪 Yemen | -1.0 | 3.6 |
| 9 | 🇪🇬 Egypt | -1.0 | 4.0 |
| 10 | 🇮🇳 India | -0.9 | 4.1 |
| 11 | 🇧🇩 Bangladesh | -0.9 | 3.9 |
| 12 | 🇨🇩 DRC | -0.7 | 3.3 |
| 13 | 🇹🇳 Tunisia | -0.7 | 4.4 |
| 14 | 🇨🇦 Canada | -0.6 | 6.9 |
| 15 | 🇺🇸 U.S. | -0.6 | 6.7 |
| 16 | 🇨🇴 Colombia | -0.5 | 5.7 |
| 17 | 🇵🇦 Panama | -0.5 | 6.4 |
| 18 | 🇵🇰 Pakistan | -0.5 | 4.7 |
| 19 | 🇿🇼 Zimbabwe | -0.5 | 3.3 |
| 20 | 🇮🇪 Ireland | -0.5 | 6.8 |
| N/A | 🌍 World | +0.1 | 5.5 |
Nine countries in total saw their happiness score drop by a full point or more, on the 0–10 scale.
Noticeably, many of them have seen years of social and economic upheaval. Lebanon, for example, has been grappling with decades of corruption, and a severe liquidity crisis since 2019 that has resulted in a banking system collapse, sending poverty levels skyrocketing.
In Jordan, unprecedented population growth—from refugees leaving Iraq and Syria—has aggravated unemployment rates. A somewhat abrupt change in the line of succession has also raised concerns about political stability in the country.

-

 Markets1 week ago
U.S. Debt Interest Payments Reach $1 Trillion
-

 Business2 weeks ago
Charted: Big Four Market Share by S&P 500 Audits
-

 Real Estate2 weeks ago
Ranked: The Most Valuable Housing Markets in America
-

 Money2 weeks ago
Which States Have the Highest Minimum Wage in America?
-

 AI2 weeks ago
Ranked: Semiconductor Companies by Industry Revenue Share
-

 Markets2 weeks ago
Ranked: The World’s Top Flight Routes, by Revenue
-

 Demographics2 weeks ago
Population Projections: The World’s 6 Largest Countries in 2075
-

 Markets2 weeks ago
The Top 10 States by Real GDP Growth in 2023