Technology
Visualizing Internet Suppression Around the World
View the full-size version of the infographic
Visualizing Internet Suppression Around the World
View the full-size version of the infographic by clicking here
When people think of freedom, they often think it in the physical sense, such as the ability to act and behave in certain ways without fear of punishment, or freedom of movement within one’s country.
When a nation chooses to restrict freedom in the physical world, the results are often hard to ignore. Protests are met with tear gas and rubber bullets. Road checks pop up along transportation routes. Journalists are detained.
In the digital world, creeping control often appears in more subtle ways. Personal data is accessed without us knowing, and swarms of suspiciously like-minded accounts begin to overwhelm meaningful conversations on social media platforms.
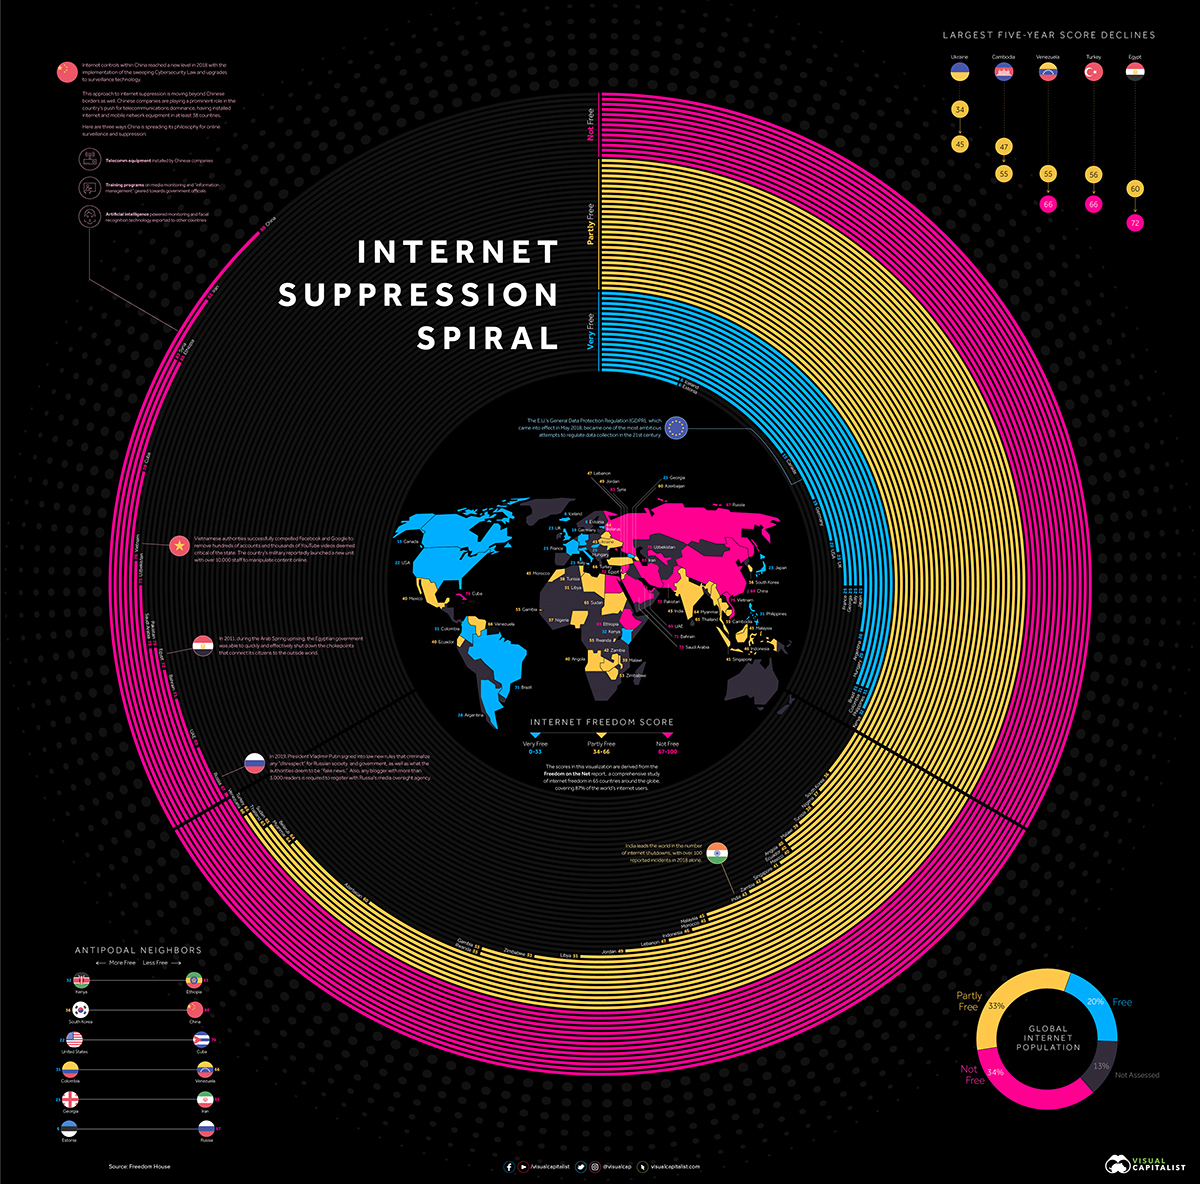
The Freedom on the Net Report, by Freedom House, breaks internet suppression down into a number of elements, from content filtering to detention of online publishers. Here’s how a number of countries around the world stack up:
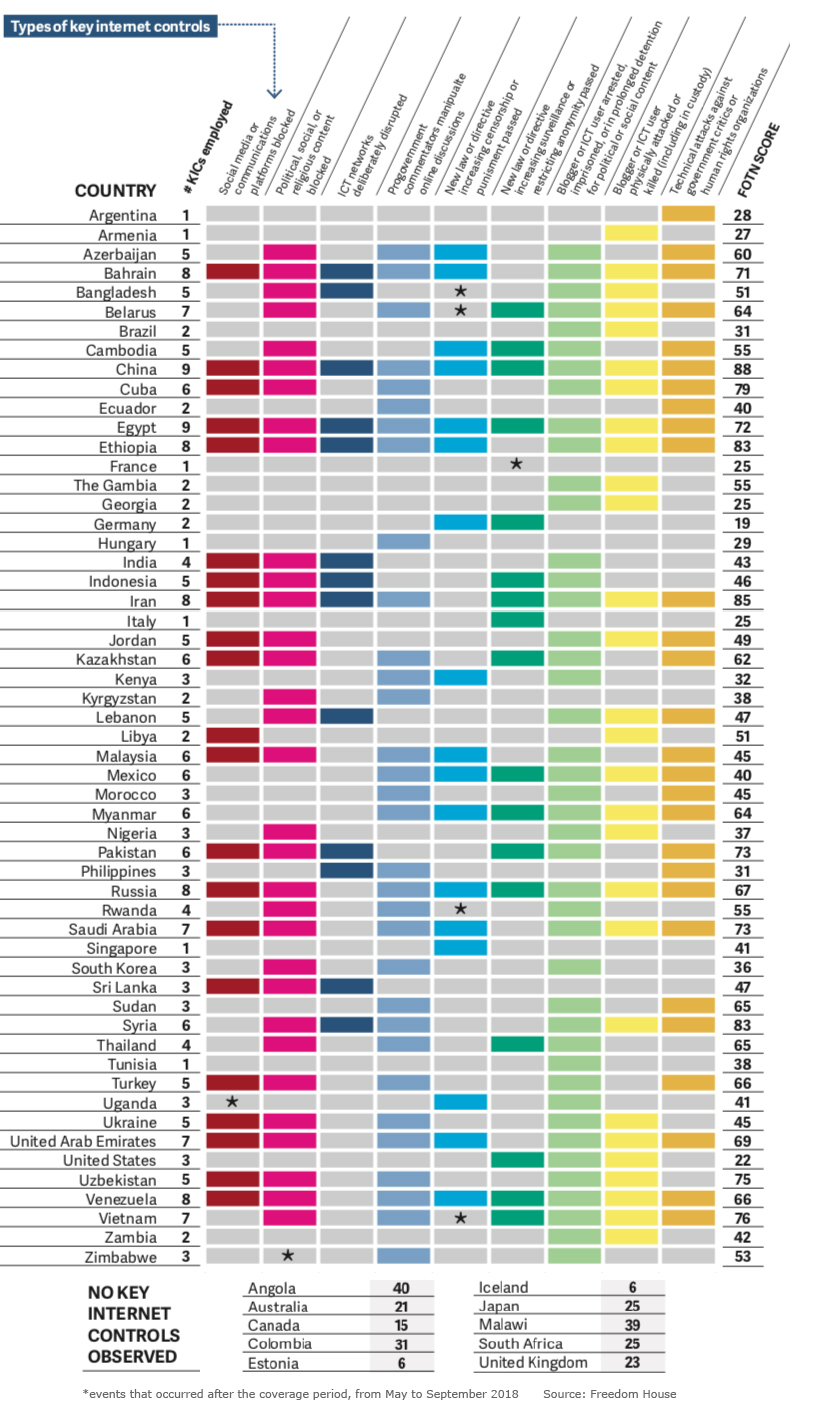
According to the report, internet freedom around the world has been falling steadily for eight consecutive years. Today’s graphic is an international look at the state of internet freedom.
First World Problems
At its best, the internet allows us to seek out information and make choices free from coercion or hidden manipulation. Even in countries with relatively open access to information this is becoming increasingly difficult.
In Western countries, internet suppression often rears its head in the form of misinformation and excessive data collection. The Cambridge Analytica scandal was a potent example of how the vast amounts of data collected by platforms and third parties can be used to manipulate public opinion.
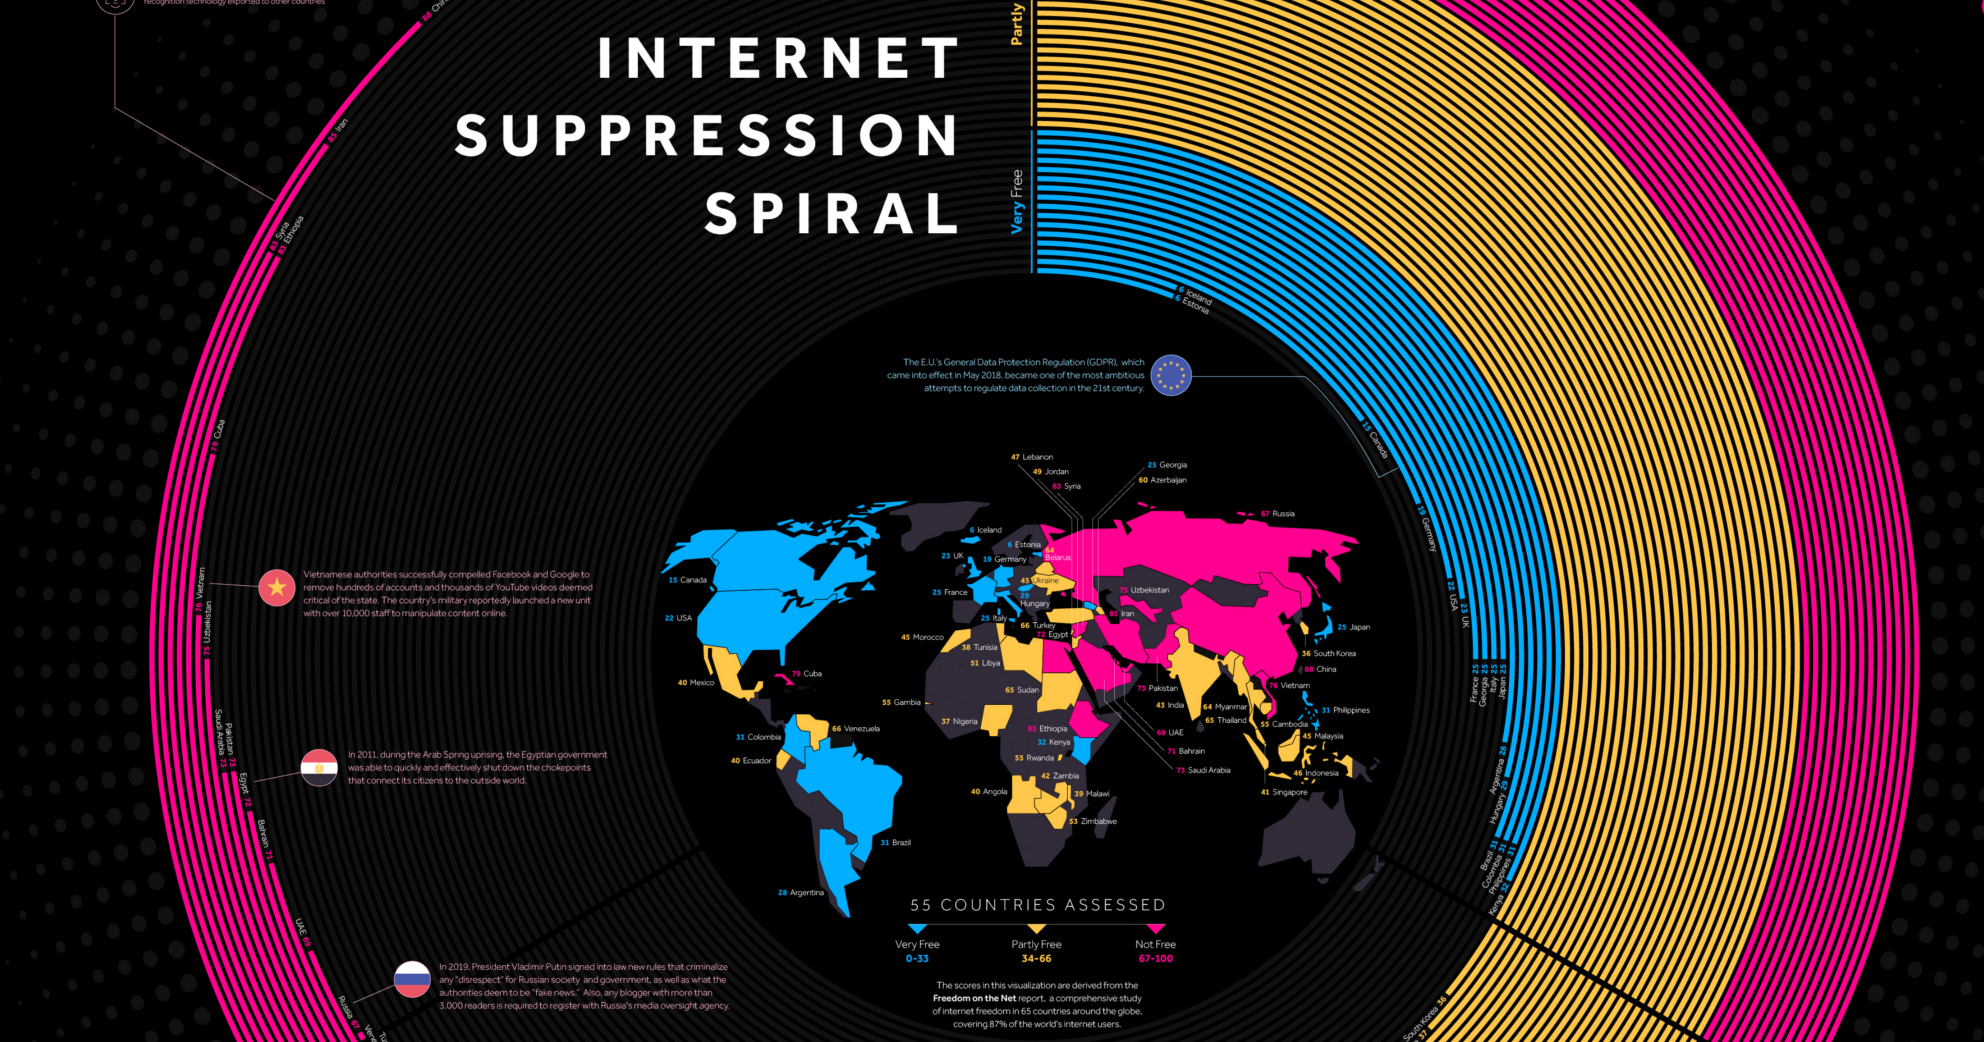
The backlash to this data collection by tech companies also produced one of the most promising developments in the past year – the EU’s General Data Protection Regulation (GDPR). While the regulations are not applicable to government and military entities, it does create a pathway to increased transparency and accountability for companies collecting user data.
Control Creep
Around one-third of the people in the world live in countries that are considered “partly free”.
For most users, access to online information may not look too different from the internet experience in Iceland or Estonia, but there are creeping controls in specific areas.
In Turkey, Wikipedia was blocked and social media companies were compelled to censor political commentary. The country had one of the largest declines in internet freedom in recent years.
In Nigeria, data localization requirements have been enacted. This follows the lead of places like China and Vietnam, where servers must be located within the country for “the inspection, storage, and provision of information at the request of competent state management agencies.”
Access Denied
For many people around the world – particularly in Asia – accessing information online is a fundamentally different experience. Content published by an individual can be monitored and censored, and online activity that would be considered benign in Western countries can result in severe real-world consequences such as imprisonment or death.
As today’s data visualization vividly illustrates, China has by far the most restricted internet of the 65 countries covered in the report.
Network operators in the country are obligated to store all user data within the country (which can be accessed by governmental bodies), and are required to immediately stop the transmission of “banned content”. The country is also further cracking down the use of VPNs, which are used to circumvent China’s Great Firewall.
Of course, China is not alone in the desire to implement tight controls over online access. Many places, from Vietnam to Ethiopia, are eager to embrace the “China Model”. The country, which is aggressively ramping up its influence around globe, is more than happy expand its influence through exporting models of governance to new technologies, such as facial recognition.
Meanwhile, in Russia, the popular messaging app, Telegram, was blocked due to its refusal to allow the country’s security service access to encrypted data. This example highlights a growing dilemma faced by tech companies operating internationally – acquiesce to government demands, or lose access to huge markets.
A Tale of Two Internets
Today, there are two prodominant flavors of internet on the menu – the Silicon Valley offering dominated by major tech companies, and the top-down, state-controlled version being spread in earnest by Beijing. It would be a mistake to believe that the former is the clear choice for jurisdictions around the world.
In many countries in Africa, communications infrastructure is still being built out, so assistance from Chinese companies is accepted with open arms.
Our Chinese friends have managed to block such media in their country and replaced them with their homegrown sites that are safe, constructive, and popular.
– Edwin Ngonyani, Tanzania’s Deputy Minister of Works, Transport and Communication
Even though the internet is now three decades old, its form is still evolving. It remains to be seen whether the divergence between free and not free jurisdictions continues to grow.


Technology
Ranked: Semiconductor Companies by Industry Revenue Share
Nvidia is coming for Intel’s crown. Samsung is losing ground. AI is transforming the space. We break down revenue for semiconductor companies.


Semiconductor Companies by Industry Revenue Share
This was originally posted on our Voronoi app. Download the app for free on Apple or Android and discover incredible data-driven charts from a variety of trusted sources.
Did you know that some computer chips are now retailing for the price of a new BMW?
As computers invade nearly every sphere of life, so too have the chips that power them, raising the revenues of the businesses dedicated to designing them.
But how did various chipmakers measure against each other last year?
We rank the biggest semiconductor companies by their percentage share of the industry’s revenues in 2023, using data from Omdia research.
Which Chip Company Made the Most Money in 2023?
Market leader and industry-defining veteran Intel still holds the crown for the most revenue in the sector, crossing $50 billion in 2023, or 10% of the broader industry’s topline.
All is not well at Intel, however, with the company’s stock price down over 20% year-to-date after it revealed billion-dollar losses in its foundry business.
| Rank | Company | 2023 Revenue | % of Industry Revenue |
|---|---|---|---|
| 1 | Intel | $51B | 9.4% |
| 2 | NVIDIA | $49B | 9.0% |
| 3 | Samsung Electronics | $44B | 8.1% |
| 4 | Qualcomm | $31B | 5.7% |
| 5 | Broadcom | $28B | 5.2% |
| 6 | SK Hynix | $24B | 4.4% |
| 7 | AMD | $22B | 4.1% |
| 8 | Apple | $19B | 3.4% |
| 9 | Infineon Tech | $17B | 3.2% |
| 10 | STMicroelectronics | $17B | 3.2% |
| 11 | Texas Instruments | $17B | 3.1% |
| 12 | Micron Technology | $16B | 2.9% |
| 13 | MediaTek | $14B | 2.6% |
| 14 | NXP | $13B | 2.4% |
| 15 | Analog Devices | $12B | 2.2% |
| 16 | Renesas Electronics Corporation | $11B | 1.9% |
| 17 | Sony Semiconductor Solutions Corporation | $10B | 1.9% |
| 18 | Microchip Technology | $8B | 1.5% |
| 19 | Onsemi | $8B | 1.4% |
| 20 | KIOXIA Corporation | $7B | 1.3% |
| N/A | Others | $126B | 23.2% |
| N/A | Total | $545B | 100% |
Note: Figures are rounded. Totals and percentages may not sum to 100.
Meanwhile, Nvidia is very close to overtaking Intel, after declaring $49 billion of topline revenue for 2023. This is more than double its 2022 revenue ($21 billion), increasing its share of industry revenues to 9%.
Nvidia’s meteoric rise has gotten a huge thumbs-up from investors. It became a trillion dollar stock last year, and broke the single-day gain record for market capitalization this year.
Other chipmakers haven’t been as successful. Out of the top 20 semiconductor companies by revenue, 12 did not match their 2022 revenues, including big names like Intel, Samsung, and AMD.
The Many Different Types of Chipmakers
All of these companies may belong to the same industry, but they don’t focus on the same niche.
According to Investopedia, there are four major types of chips, depending on their functionality: microprocessors, memory chips, standard chips, and complex systems on a chip.
Nvidia’s core business was once GPUs for computers (graphics processing units), but in recent years this has drastically shifted towards microprocessors for analytics and AI.
These specialized chips seem to be where the majority of growth is occurring within the sector. For example, companies that are largely in the memory segment—Samsung, SK Hynix, and Micron Technology—saw peak revenues in the mid-2010s.

-

 Business2 weeks ago
America’s Top Companies by Revenue (1994 vs. 2023)
-

 Environment1 week ago
Ranked: Top Countries by Total Forest Loss Since 2001
-

 Markets1 week ago
Visualizing America’s Shortage of Affordable Homes
-

 Maps2 weeks ago
Mapped: Average Wages Across Europe
-

 Mining2 weeks ago
Charted: The Value Gap Between the Gold Price and Gold Miners
-

 Demographics2 weeks ago
Visualizing the Size of the Global Senior Population
-

 Misc2 weeks ago
Tesla Is Once Again the World’s Best-Selling EV Company
-

 Technology2 weeks ago
Ranked: The Most Popular Smartphone Brands in the U.S.