Markets
Interest Rate Hikes vs. Inflation Rate, by Country
Interest Rate Hikes vs. Inflation Rate, by Country
Imagine today’s high inflation like a car speeding down a hill. In order to slow it down, you need to hit the brakes. In this case, the “brakes” are interest rate hikes intended to slow spending. However, some central banks are hitting the brakes faster than others.
This graphic uses data from central banks and government websites to show how policy interest rates and inflation rates have changed since the start of the year. It was inspired by a chart created by Macrobond.
How Do Interest Rate Hikes Combat Inflation?
To understand how interest rates influence inflation, we need to understand how inflation works. Inflation is the result of too much money chasing too few goods. Over the last several months, this has occurred amid a surge in demand and supply chain disruptions worsened by Russia’s invasion of Ukraine.
In an effort to combat inflation, central banks will raise their policy rate. This is the rate they charge commercial banks for loans or pay commercial banks for deposits. Commercial banks pass on a portion of these higher rates to their customers, which reduces the purchasing power of businesses and consumers. For example, it becomes more expensive to borrow money for a house or car.
Ultimately, interest rate hikes act to slow spending and encourage saving. This motivates companies to increase prices at a slower rate, or lower prices, to stimulate demand.
Rising Interest Rates and Inflation
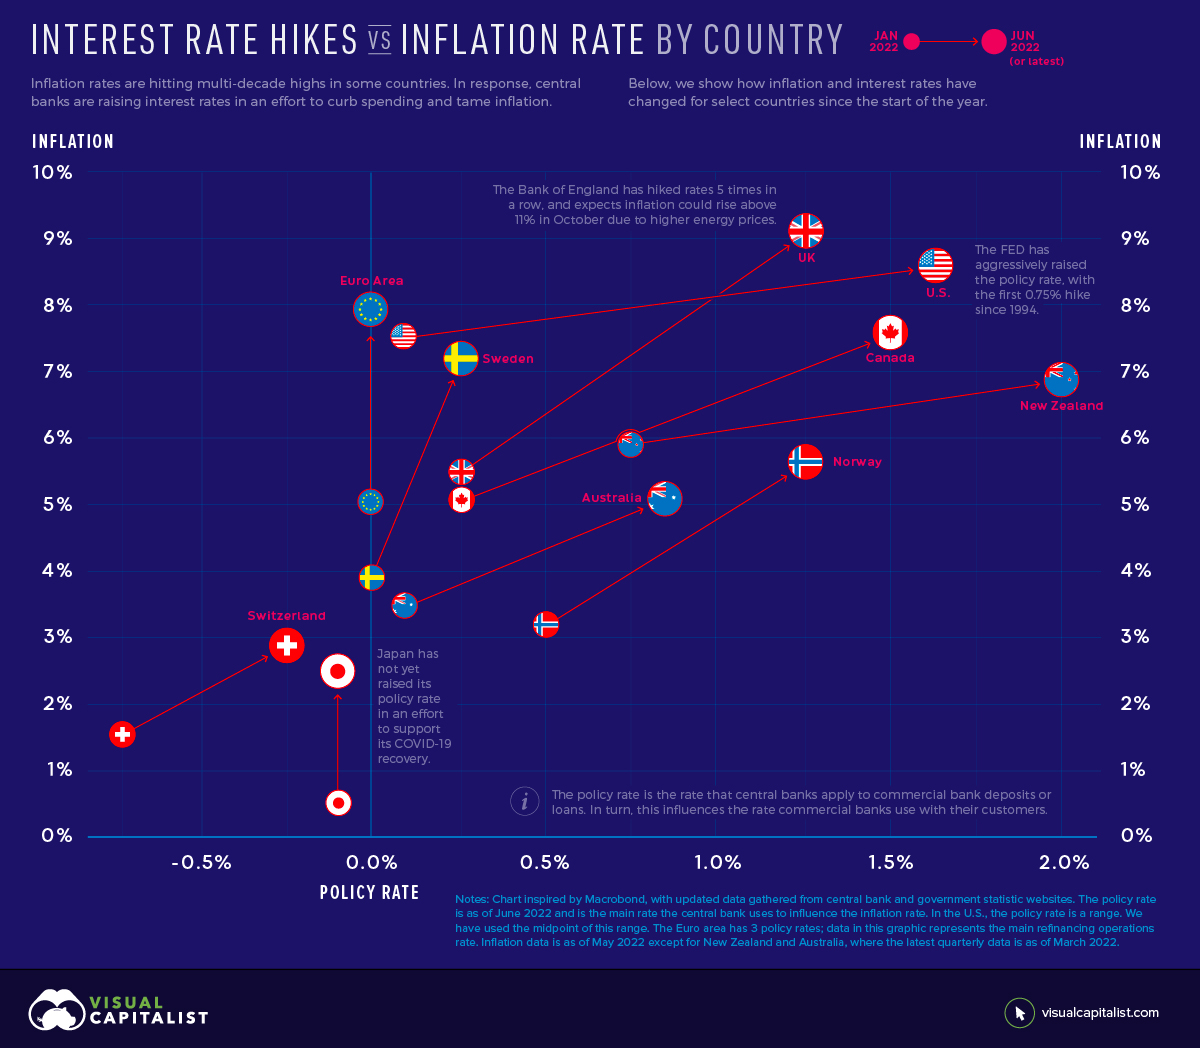
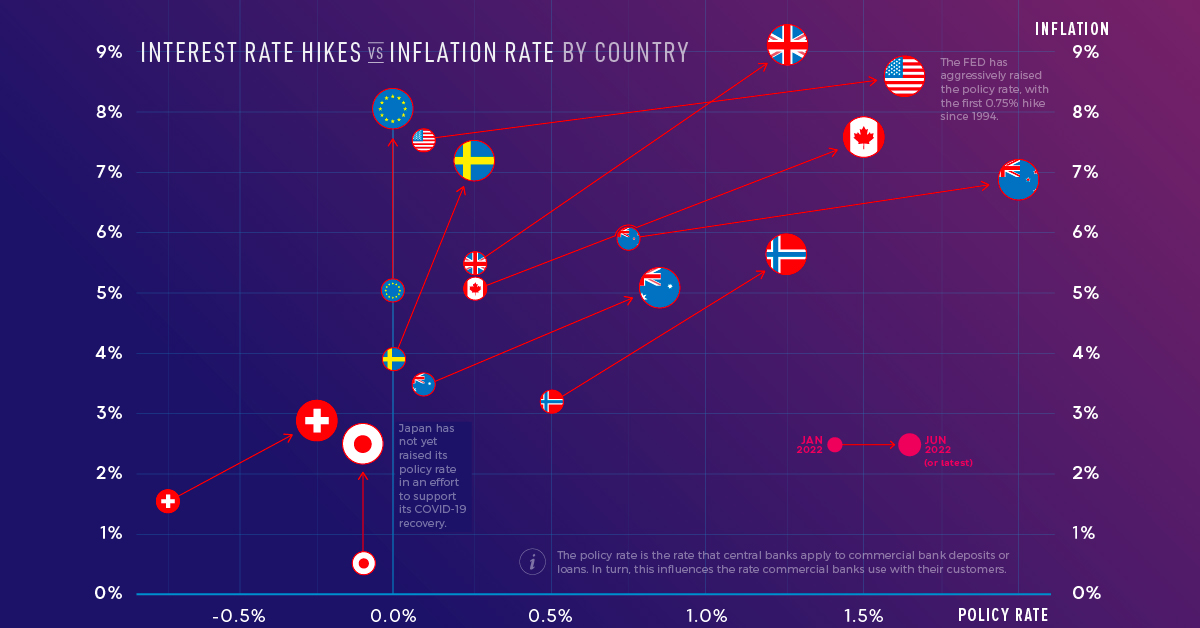
With inflation rates hitting multi-decade highs in some countries, many central banks have announced interest rate hikes. Below, we show how the inflation rate and policy interest rate have changed for select countries and regions since January 2022. The jurisdictions are ordered from highest to lowest current inflation rate.
| Jurisdiction | Jan 2022 Inflation | May 2022 Inflation | Jan 2022 Policy Rate | Jun 2022 Policy Rate |
|---|---|---|---|---|
| UK | 5.50% | 9.10% | 0.25% | 1.25% |
| U.S. | 7.50% | 8.60% | 0.00%-0.25% | 1.50%-1.75% |
| Euro Area | 5.10% | 8.10% | 0.00% | 0.00% |
| Canada | 5.10% | 7.70% | 0.25% | 1.50% |
| Sweden | 3.90% | 7.20% | 0.00% | 0.25% |
| New Zealand | 5.90% | 6.90% | 0.75% | 2.00% |
| Norway | 3.20% | 5.70% | 0.50% | 1.25% |
| Australia | 3.50% | 5.10% | 0.10% | 0.85% |
| Switzerland | 1.60% | 2.90% | -0.75% | -0.25% |
| Japan | 0.50% | 2.50% | -0.10% | -0.10% |
The Euro area has 3 policy rates; the data above represents the main refinancing operations rate. Inflation data is as of May 2022 except for New Zealand and Australia, where the latest quarterly data is as of March 2022.
The U.S. Federal Reserve has been the most aggressive with its interest rate hikes. It has raised its policy rate by 1.5% since January, with half of that increase occurring at the June 2022 meeting. Jerome Powell, the Federal Reserve chair, said the committee would like to “do a little more front-end loading” to bring policy rates to normal levels. The action comes as the U.S. faces its highest inflation rate in 40 years.
On the other hand, the European Union is experiencing inflation of 8.1% but has not yet raised its policy rate. The European Central Bank has, however, provided clear forward guidance. It intends to raise rates by 0.25% in July, by a possibly larger increment in September, and with gradual but sustained increases thereafter. Clear forward guidance is intended to help people make spending and investment decisions, and avoid surprises that could disrupt markets.
Pacing Interest Rate Hikes
Raising interest rates is a fine balancing act. If central banks raise rates too quickly, it’s like slamming the brakes on that car speeding downhill: the economy could come to a standstill. This occurred in the U.S. in the 1980’s when the Federal Reserve, led by Chair Paul Volcker, raised the policy rate to 20%. The economy went into a recession, though the aggressive monetary policy did eventually tame double digit inflation.
However, if rates are raised too slowly, inflation could gather enough momentum that it becomes difficult to stop. The longer high price increases linger, the more future inflation expectations build. This can result in people buying more in anticipation of prices rising further, perpetuating high demand.
“There’s always a risk of going too far or not going far enough, and it’s going to be a very difficult judgment to make.” — Jerome Powell, U.S. Federal Reserve Chair
It’s worth noting that while central banks can influence demand through policy rates, this is only one side of the equation. Inflation is also being caused by supply chain issues, a problem that is more or less outside of the control of central banks.


Markets
U.S. Debt Interest Payments Reach $1 Trillion
U.S. debt interest payments have surged past the $1 trillion dollar mark, amid high interest rates and an ever-expanding debt burden.


U.S. Debt Interest Payments Reach $1 Trillion
This was originally posted on our Voronoi app. Download the app for free on iOS or Android and discover incredible data-driven charts from a variety of trusted sources.
The cost of paying for America’s national debt crossed the $1 trillion dollar mark in 2023, driven by high interest rates and a record $34 trillion mountain of debt.
Over the last decade, U.S. debt interest payments have more than doubled amid vast government spending during the pandemic crisis. As debt payments continue to soar, the Congressional Budget Office (CBO) reported that debt servicing costs surpassed defense spending for the first time ever this year.
This graphic shows the sharp rise in U.S. debt payments, based on data from the Federal Reserve.
A $1 Trillion Interest Bill, and Growing
Below, we show how U.S. debt interest payments have risen at a faster pace than at another time in modern history:
| Date | Interest Payments | U.S. National Debt |
|---|---|---|
| 2023 | $1.0T | $34.0T |
| 2022 | $830B | $31.4T |
| 2021 | $612B | $29.6T |
| 2020 | $518B | $27.7T |
| 2019 | $564B | $23.2T |
| 2018 | $571B | $22.0T |
| 2017 | $493B | $20.5T |
| 2016 | $460B | $20.0T |
| 2015 | $435B | $18.9T |
| 2014 | $442B | $18.1T |
| 2013 | $425B | $17.2T |
| 2012 | $417B | $16.4T |
| 2011 | $433B | $15.2T |
| 2010 | $400B | $14.0T |
| 2009 | $354B | $12.3T |
| 2008 | $380B | $10.7T |
| 2007 | $414B | $9.2T |
| 2006 | $387B | $8.7T |
| 2005 | $355B | $8.2T |
| 2004 | $318B | $7.6T |
| 2003 | $294B | $7.0T |
| 2002 | $298B | $6.4T |
| 2001 | $318B | $5.9T |
| 2000 | $353B | $5.7T |
| 1999 | $353B | $5.8T |
| 1998 | $360B | $5.6T |
| 1997 | $368B | $5.5T |
| 1996 | $362B | $5.3T |
| 1995 | $357B | $5.0T |
| 1994 | $334B | $4.8T |
| 1993 | $311B | $4.5T |
| 1992 | $306B | $4.2T |
| 1991 | $308B | $3.8T |
| 1990 | $298B | $3.4T |
| 1989 | $275B | $3.0T |
| 1988 | $254B | $2.7T |
| 1987 | $240B | $2.4T |
| 1986 | $225B | $2.2T |
| 1985 | $219B | $1.9T |
| 1984 | $205B | $1.7T |
| 1983 | $176B | $1.4T |
| 1982 | $157B | $1.2T |
| 1981 | $142B | $1.0T |
| 1980 | $113B | $930.2B |
| 1979 | $96B | $845.1B |
| 1978 | $84B | $789.2B |
| 1977 | $69B | $718.9B |
| 1976 | $61B | $653.5B |
| 1975 | $55B | $576.6B |
| 1974 | $50B | $492.7B |
| 1973 | $45B | $469.1B |
| 1972 | $39B | $448.5B |
| 1971 | $36B | $424.1B |
| 1970 | $35B | $389.2B |
| 1969 | $30B | $368.2B |
| 1968 | $25B | $358.0B |
| 1967 | $23B | $344.7B |
| 1966 | $21B | $329.3B |
Interest payments represent seasonally adjusted annual rate at the end of Q4.
At current rates, the U.S. national debt is growing by a remarkable $1 trillion about every 100 days, equal to roughly $3.6 trillion per year.
As the national debt has ballooned, debt payments even exceeded Medicaid outlays in 2023—one of the government’s largest expenditures. On average, the U.S. spent more than $2 billion per day on interest costs last year. Going further, the U.S. government is projected to spend a historic $12.4 trillion on interest payments over the next decade, averaging about $37,100 per American.
Exacerbating matters is that the U.S. is running a steep deficit, which stood at $1.1 trillion for the first six months of fiscal 2024. This has accelerated due to the 43% increase in debt servicing costs along with a $31 billion dollar increase in defense spending from a year earlier. Additionally, a $30 billion increase in funding for the Federal Deposit Insurance Corporation in light of the regional banking crisis last year was a major contributor to the deficit increase.
Overall, the CBO forecasts that roughly 75% of the federal deficit’s increase will be due to interest costs by 2034.

-

 Green1 week ago
Ranked: The Countries With the Most Air Pollution in 2023
-

 Automotive2 weeks ago
Almost Every EV Stock is Down After Q1 2024
-

 AI2 weeks ago
The Stock Performance of U.S. Chipmakers So Far in 2024
-

 Markets2 weeks ago
Charted: Big Four Market Share by S&P 500 Audits
-

 Real Estate2 weeks ago
Ranked: The Most Valuable Housing Markets in America
-

 Money2 weeks ago
Which States Have the Highest Minimum Wage in America?
-

 AI2 weeks ago
Ranked: Semiconductor Companies by Industry Revenue Share
-

 Travel2 weeks ago
Ranked: The World’s Top Flight Routes, by Revenue