Markets
Interest Rate Hikes vs. Inflation Rate, by Country
Interest Rate Hikes vs. Inflation Rate, by Country
Imagine today’s high inflation like a car speeding down a hill. In order to slow it down, you need to hit the brakes. In this case, the “brakes” are interest rate hikes intended to slow spending. However, some central banks are hitting the brakes faster than others.
This graphic uses data from central banks and government websites to show how policy interest rates and inflation rates have changed since the start of the year. It was inspired by a chart created by Macrobond.
How Do Interest Rate Hikes Combat Inflation?
To understand how interest rates influence inflation, we need to understand how inflation works. Inflation is the result of too much money chasing too few goods. Over the last several months, this has occurred amid a surge in demand and supply chain disruptions worsened by Russia’s invasion of Ukraine.
In an effort to combat inflation, central banks will raise their policy rate. This is the rate they charge commercial banks for loans or pay commercial banks for deposits. Commercial banks pass on a portion of these higher rates to their customers, which reduces the purchasing power of businesses and consumers. For example, it becomes more expensive to borrow money for a house or car.
Ultimately, interest rate hikes act to slow spending and encourage saving. This motivates companies to increase prices at a slower rate, or lower prices, to stimulate demand.
Rising Interest Rates and Inflation
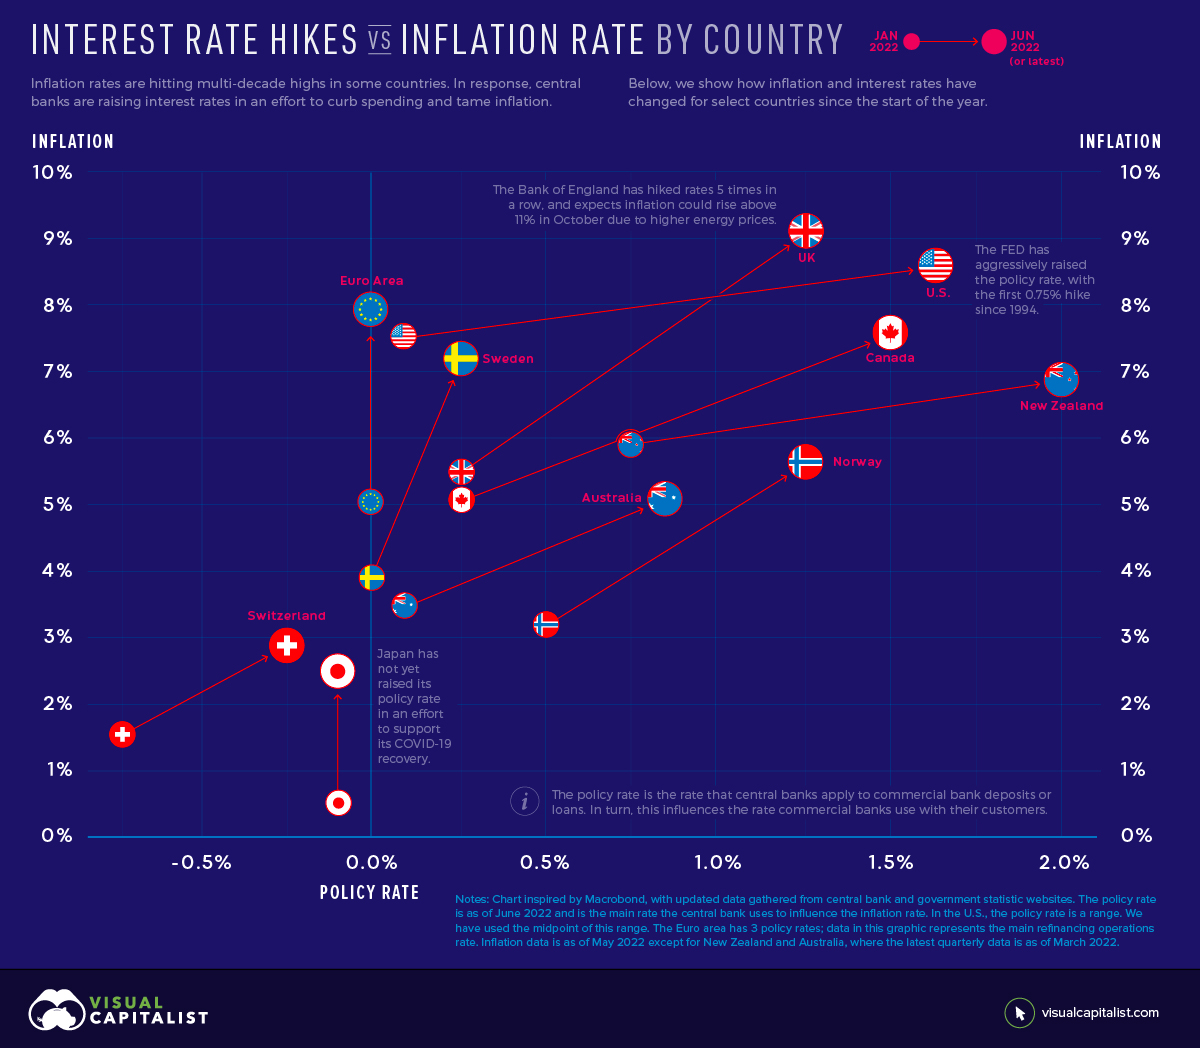
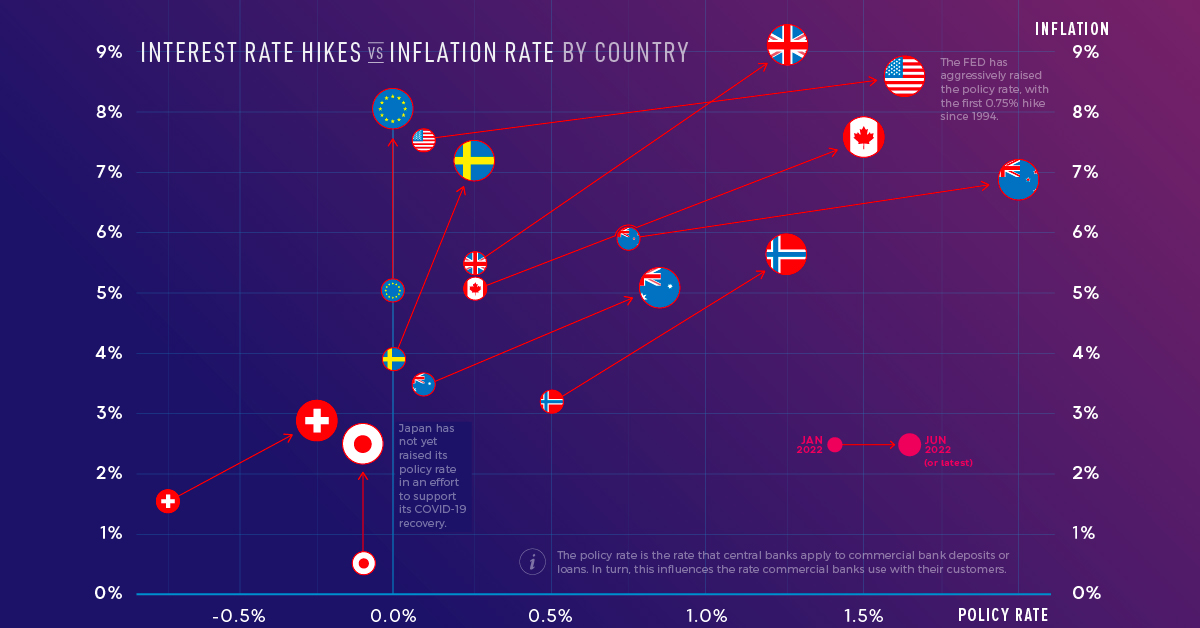
With inflation rates hitting multi-decade highs in some countries, many central banks have announced interest rate hikes. Below, we show how the inflation rate and policy interest rate have changed for select countries and regions since January 2022. The jurisdictions are ordered from highest to lowest current inflation rate.
| Jurisdiction | Jan 2022 Inflation | May 2022 Inflation | Jan 2022 Policy Rate | Jun 2022 Policy Rate |
|---|---|---|---|---|
| UK | 5.50% | 9.10% | 0.25% | 1.25% |
| U.S. | 7.50% | 8.60% | 0.00%-0.25% | 1.50%-1.75% |
| Euro Area | 5.10% | 8.10% | 0.00% | 0.00% |
| Canada | 5.10% | 7.70% | 0.25% | 1.50% |
| Sweden | 3.90% | 7.20% | 0.00% | 0.25% |
| New Zealand | 5.90% | 6.90% | 0.75% | 2.00% |
| Norway | 3.20% | 5.70% | 0.50% | 1.25% |
| Australia | 3.50% | 5.10% | 0.10% | 0.85% |
| Switzerland | 1.60% | 2.90% | -0.75% | -0.25% |
| Japan | 0.50% | 2.50% | -0.10% | -0.10% |
The Euro area has 3 policy rates; the data above represents the main refinancing operations rate. Inflation data is as of May 2022 except for New Zealand and Australia, where the latest quarterly data is as of March 2022.
The U.S. Federal Reserve has been the most aggressive with its interest rate hikes. It has raised its policy rate by 1.5% since January, with half of that increase occurring at the June 2022 meeting. Jerome Powell, the Federal Reserve chair, said the committee would like to “do a little more front-end loading” to bring policy rates to normal levels. The action comes as the U.S. faces its highest inflation rate in 40 years.
On the other hand, the European Union is experiencing inflation of 8.1% but has not yet raised its policy rate. The European Central Bank has, however, provided clear forward guidance. It intends to raise rates by 0.25% in July, by a possibly larger increment in September, and with gradual but sustained increases thereafter. Clear forward guidance is intended to help people make spending and investment decisions, and avoid surprises that could disrupt markets.
Pacing Interest Rate Hikes
Raising interest rates is a fine balancing act. If central banks raise rates too quickly, it’s like slamming the brakes on that car speeding downhill: the economy could come to a standstill. This occurred in the U.S. in the 1980’s when the Federal Reserve, led by Chair Paul Volcker, raised the policy rate to 20%. The economy went into a recession, though the aggressive monetary policy did eventually tame double digit inflation.
However, if rates are raised too slowly, inflation could gather enough momentum that it becomes difficult to stop. The longer high price increases linger, the more future inflation expectations build. This can result in people buying more in anticipation of prices rising further, perpetuating high demand.
“There’s always a risk of going too far or not going far enough, and it’s going to be a very difficult judgment to make.” — Jerome Powell, U.S. Federal Reserve Chair
It’s worth noting that while central banks can influence demand through policy rates, this is only one side of the equation. Inflation is also being caused by supply chain issues, a problem that is more or less outside of the control of central banks.


Economy
Economic Growth Forecasts for G7 and BRICS Countries in 2024
The IMF has released its economic growth forecasts for 2024. How do the G7 and BRICS countries compare?


G7 & BRICS Real GDP Growth Forecasts for 2024
The International Monetary Fund’s (IMF) has released its real gross domestic product (GDP) growth forecasts for 2024, and while global growth is projected to stay steady at 3.2%, various major nations are seeing declining forecasts.
This chart visualizes the 2024 real GDP growth forecasts using data from the IMF’s 2024 World Economic Outlook for G7 and BRICS member nations along with Saudi Arabia, which is still considering an invitation to join the bloc.
Get the Key Insights of the IMF’s World Economic Outlook
Want a visual breakdown of the insights from the IMF’s 2024 World Economic Outlook report?
This visual is part of a special dispatch of the key takeaways exclusively for VC+ members.
Get the full dispatch of charts by signing up to VC+.
Mixed Economic Growth Prospects for Major Nations in 2024
Economic growth projections by the IMF for major nations are mixed, with the majority of G7 and BRICS countries forecasted to have slower growth in 2024 compared to 2023.
Only three BRICS-invited or member countries, Saudi Arabia, the UAE, and South Africa, have higher projected real GDP growth rates in 2024 than last year.
| Group | Country | Real GDP Growth (2023) | Real GDP Growth (2024P) |
|---|---|---|---|
| G7 | 🇺🇸 U.S. | 2.5% | 2.7% |
| G7 | 🇨🇦 Canada | 1.1% | 1.2% |
| G7 | 🇯🇵 Japan | 1.9% | 0.9% |
| G7 | 🇫🇷 France | 0.9% | 0.7% |
| G7 | 🇮🇹 Italy | 0.9% | 0.7% |
| G7 | 🇬🇧 UK | 0.1% | 0.5% |
| G7 | 🇩🇪 Germany | -0.3% | 0.2% |
| BRICS | 🇮🇳 India | 7.8% | 6.8% |
| BRICS | 🇨🇳 China | 5.2% | 4.6% |
| BRICS | 🇦🇪 UAE | 3.4% | 3.5% |
| BRICS | 🇮🇷 Iran | 4.7% | 3.3% |
| BRICS | 🇷🇺 Russia | 3.6% | 3.2% |
| BRICS | 🇪🇬 Egypt | 3.8% | 3.0% |
| BRICS-invited | 🇸🇦 Saudi Arabia | -0.8% | 2.6% |
| BRICS | 🇧🇷 Brazil | 2.9% | 2.2% |
| BRICS | 🇿🇦 South Africa | 0.6% | 0.9% |
| BRICS | 🇪🇹 Ethiopia | 7.2% | 6.2% |
| 🌍 World | 3.2% | 3.2% |
China and India are forecasted to maintain relatively high growth rates in 2024 at 4.6% and 6.8% respectively, but compared to the previous year, China is growing 0.6 percentage points slower while India is an entire percentage point slower.
On the other hand, four G7 nations are set to grow faster than last year, which includes Germany making its comeback from its negative real GDP growth of -0.3% in 2023.
Faster Growth for BRICS than G7 Nations
Despite mostly lower growth forecasts in 2024 compared to 2023, BRICS nations still have a significantly higher average growth forecast at 3.6% compared to the G7 average of 1%.
While the G7 countries’ combined GDP is around $15 trillion greater than the BRICS nations, with continued higher growth rates and the potential to add more members, BRICS looks likely to overtake the G7 in economic size within two decades.
BRICS Expansion Stutters Before October 2024 Summit
BRICS’ recent expansion has stuttered slightly, as Argentina’s newly-elected president Javier Milei declined its invitation and Saudi Arabia clarified that the country is still considering its invitation and has not joined BRICS yet.
Even with these initial growing pains, South Africa’s Foreign Minister Naledi Pandor told reporters in February that 34 different countries have submitted applications to join the growing BRICS bloc.
Any changes to the group are likely to be announced leading up to or at the 2024 BRICS summit which takes place October 22-24 in Kazan, Russia.
Get the Full Analysis of the IMF’s Outlook on VC+
This visual is part of an exclusive special dispatch for VC+ members which breaks down the key takeaways from the IMF’s 2024 World Economic Outlook.
For the full set of charts and analysis, sign up for VC+.

-

 Markets1 week ago
U.S. Debt Interest Payments Reach $1 Trillion
-

 Business2 weeks ago
Charted: Big Four Market Share by S&P 500 Audits
-

 Real Estate2 weeks ago
Ranked: The Most Valuable Housing Markets in America
-

 Money2 weeks ago
Which States Have the Highest Minimum Wage in America?
-

 AI2 weeks ago
Ranked: Semiconductor Companies by Industry Revenue Share
-

 Markets2 weeks ago
Ranked: The World’s Top Flight Routes, by Revenue
-

 Demographics2 weeks ago
Population Projections: The World’s 6 Largest Countries in 2075
-

 Markets2 weeks ago
The Top 10 States by Real GDP Growth in 2023