Energy
Interactive Map: Crude Oil Pipelines and Refineries of the U.S. and Canada
var divElement = document.getElementById(‘viz1646947674022’); var vizElement = divElement.getElementsByTagName(‘object’)[0]; if ( divElement.offsetWidth > 800 ) { vizElement.style.width=’1200px’;vizElement.style.height=’2437px’;} else if ( divElement.offsetWidth > 500 ) { vizElement.style.width=’1200px’;vizElement.style.height=’2437px’;} else { vizElement.style.width=’1200px’;vizElement.style.height=’2437px’;} var scriptElement = document.createElement(‘script’); scriptElement.src = ‘https://public.tableau.com/javascripts/api/viz_v1.js’; vizElement.parentNode.insertBefore(scriptElement, vizElement);
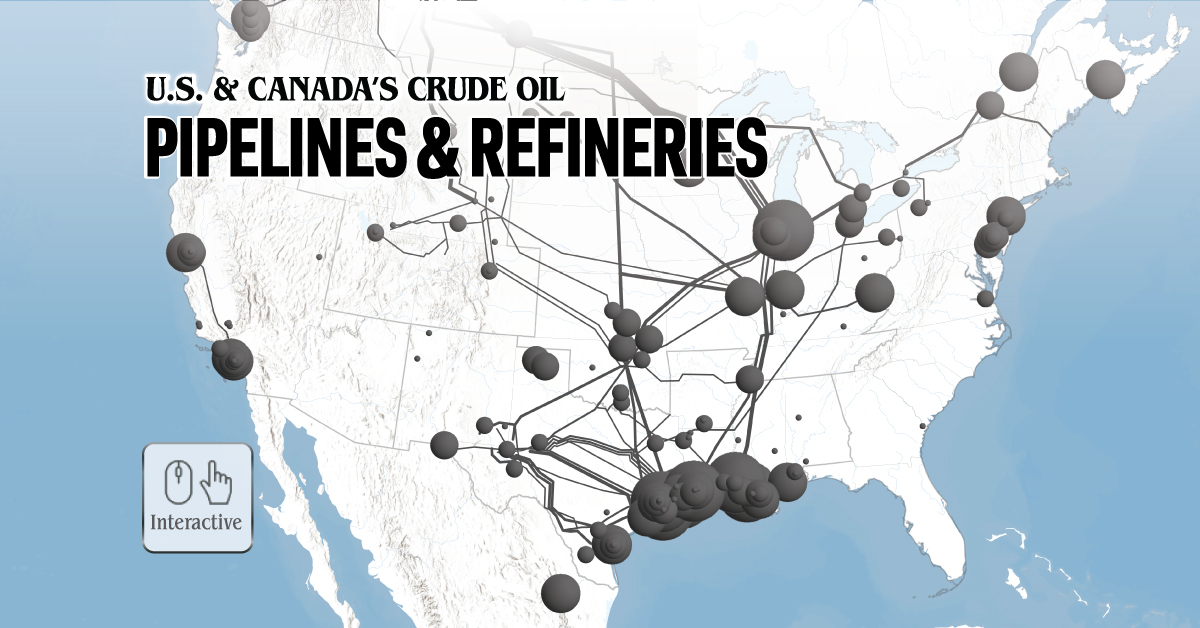
Mapped: Crude Oil Pipelines and Refineries of the U.S. and Canada
Pipelines are the primary method of transporting crude oil around the world, delivering oil and its derivative products swiftly to refineries and empowering reliant businesses.
And North America is a major oil hub. The U.S. and Canada alone are home to more than 90,000 miles of crude oil and petroleum product pipelines, along with more than 140 refineries that can process around 20 million barrels of oil every day.
This interactive graphic uses data from Rextag to map out crude oil pipelines and refineries across the U.S. and Canada, showcasing individual pipeline diameter and daily refinery throughput.
The Longest Crude Oil Pipeline Networks in North America
Since 2010, U.S. crude oil production has more than doubled from 5.4 million barrels a day to more than 11.5 million. Meanwhile, the pipeline networks needed to transport this newly produced oil have only expanded by roughly 56%.
Today, the largest pipeline network across the U.S. and Canada (with a diameter of at least 10 inches) is the 14,919 mile network managed by Plains, which spans from the northwestern tip of Alberta all the way down to the southern coasts of Texas and Louisiana.
| Company | Length of Crude Oil Pipeline Network |
|---|---|
| Plains Pipeline LP | 14,919 miles |
| Enbridge Energy Partners LP | 12,974 miles |
| Sunoco Inc. | 6,409 miles |
| MPLX LP | 5,913 miles |
| Lotus Midstream | 5,767 miles |
Source: Rextag
Enbridge owns the next largest crude oil pipeline network, with 12,974 miles of crude oil pipelines that are at least 10 inches in diameter. The Canadian company, one of the world’s largest oil companies, transports about 30% of the crude oil produced in North America.
Following the networks of Plains and Enbridge, there’s a steep drop off in the length of pipeline networks, with Sunoco’s crude oil pipeline network spanning about half the length of Enbridge’s at 6,409 miles.
The Largest Crude Oil Refineries in North America
These various sprawling pipeline networks initially carry crude oil to refineries, where it is processed into gasoline, diesel fuel, and other petroleum products.
The refineries with the largest throughput in North America are all located in the Gulf Coast (PADD 3), with the five refineries that process more than 500,000 barrels per day all located in the states of Louisiana and Texas.
| Company | City | Refining Capacity (barrels per day) |
|---|---|---|
| Motiva Enterprises | Port Arthur, Texas | 607,000 |
| Marathon Petroleum | Galveston Bay, Texas | 585,000 |
| Marathon Petroleum | Garyville, Louisiana | 578,000 |
| ExxonMobil | Baytown, Texas | 560,000 |
| ExxonMobil | Baton Rouge, Louisiana | 518,000 |
Source: Rextag
While Texas and Louisiana have six refineries that process more than 400,000 barrels per day, there are only two other facilities outside of these states with the same kind of throughput, located in Whiting, Indiana (435,000 barrels per day) and Fort McMurray, Alberta (465,000 barrels per day).
Fort McMurray’s facility is an upgrader, which differs from refineries as it upgrades heavy oils like bitumen into lighter synthetic crude oil which flows through pipelines more easily. Many oil refineries aren’t able to directly convert bitumen, which is extracted from oil sands like those found in Alberta, making upgraders a necessary part in the production and processing of crude oil from oil sands.
The Uncertain Future of New Pipelines in North America
The development of new pipelines remains a contentious issue in Canada and the U.S., with the cancellation of the Keystone XL pipeline emblematic of growing anti-pipeline sentiment. In 2021, only 14 petroleum liquids pipeline projects were completed in the U.S., which was the lowest amount of new pipelines and expansions since 2013.
But domestic energy production is once again in the spotlight due to the U.S. ban on Russian oil imports and Russia’s impending export ban on raw materials. North American consumers are now facing surging gasoline and energy prices as foreign oil is proving to be far less reliable in times of geopolitical turmoil.
It’s important to note that pipelines are not a perfect solution, as leaks and spills in just the last decade have resulted in billions of dollars of damages. From 2010 to 2020, the Pipeline and Hazardous Materials Safety Administration recorded 983 incidents that resulted in 149,000 spilled and unrecovered barrels of oil, five fatalities, 27 injuries, and more than $2.5B in damages.
But over the past five years, liquid pipeline incidents have fallen by 21% while pipeline mileage and barrels delivered have increased by more than 27%. Along with these infrastructure improvements, pipeline developers and operators emphasize the lack of better alternatives, as freight and seaborne transportation are both far less efficient and result in more carbon emissions.
Currently, pipelines remain key components of energy consumption across the U.S. and Canada, and as global energy markets face supply squeezes, international sanctions, and geopolitical turbulence, the focus on them has grown.


Lithium
Ranked: The Top 10 EV Battery Manufacturers in 2023
Asia dominates this ranking of the world’s largest EV battery manufacturers in 2023.


The Top 10 EV Battery Manufacturers in 2023
This was originally posted on our Voronoi app. Download the app for free on iOS or Android and discover incredible data-driven charts from a variety of trusted sources.
Despite efforts from the U.S. and EU to secure local domestic supply, all major EV battery manufacturers remain based in Asia.
In this graphic we rank the top 10 EV battery manufacturers by total battery deployment (measured in megawatt-hours) in 2023. The data is from EV Volumes.
Chinese Dominance
Contemporary Amperex Technology Co. Limited (CATL) has swiftly risen in less than a decade to claim the title of the largest global battery group.
The Chinese company now has a 34% share of the market and supplies batteries to a range of made-in-China vehicles, including the Tesla Model Y, SAIC’s MG4/Mulan, and various Li Auto models.
| Company | Country | 2023 Production (megawatt-hour) | Share of Total Production |
|---|---|---|---|
| CATL | 🇨🇳 China | 242,700 | 34% |
| BYD | 🇨🇳 China | 115,917 | 16% |
| LG Energy Solution | 🇰🇷 Korea | 108,487 | 15% |
| Panasonic | 🇯🇵 Japan | 56,560 | 8% |
| SK On | 🇰🇷 Korea | 40,711 | 6% |
| Samsung SDI | 🇰🇷 Korea | 35,703 | 5% |
| CALB | 🇨🇳 China | 23,493 | 3% |
| Farasis Energy | 🇨🇳 China | 16,527 | 2% |
| Envision AESC | 🇨🇳 China | 8,342 | 1% |
| Sunwoda | 🇨🇳 China | 6,979 | 1% |
| Other | - | 56,040 | 8% |
In 2023, BYD surpassed LG Energy Solution to claim second place. This was driven by demand from its own models and growth in third-party deals, including providing batteries for the made-in-Germany Tesla Model Y, Toyota bZ3, Changan UNI-V, Venucia V-Online, as well as several Haval and FAW models.
The top three battery makers (CATL, BYD, LG) collectively account for two-thirds (66%) of total battery deployment.
Once a leader in the EV battery business, Panasonic now holds the fourth position with an 8% market share, down from 9% last year. With its main client, Tesla, now sourcing batteries from multiple suppliers, the Japanese battery maker seems to be losing its competitive edge in the industry.
Overall, the global EV battery market size is projected to grow from $49 billion in 2022 to $98 billion by 2029, according to Fortune Business Insights.

-

 Markets1 week ago
U.S. Debt Interest Payments Reach $1 Trillion
-

 Business2 weeks ago
Charted: Big Four Market Share by S&P 500 Audits
-

 Real Estate2 weeks ago
Ranked: The Most Valuable Housing Markets in America
-

 Money2 weeks ago
Which States Have the Highest Minimum Wage in America?
-

 AI2 weeks ago
Ranked: Semiconductor Companies by Industry Revenue Share
-

 Markets2 weeks ago
Ranked: The World’s Top Flight Routes, by Revenue
-

 Demographics2 weeks ago
Population Projections: The World’s 6 Largest Countries in 2075
-

 Markets2 weeks ago
The Top 10 States by Real GDP Growth in 2023