Business
Infographic Timeline: 10 Years of Tinder
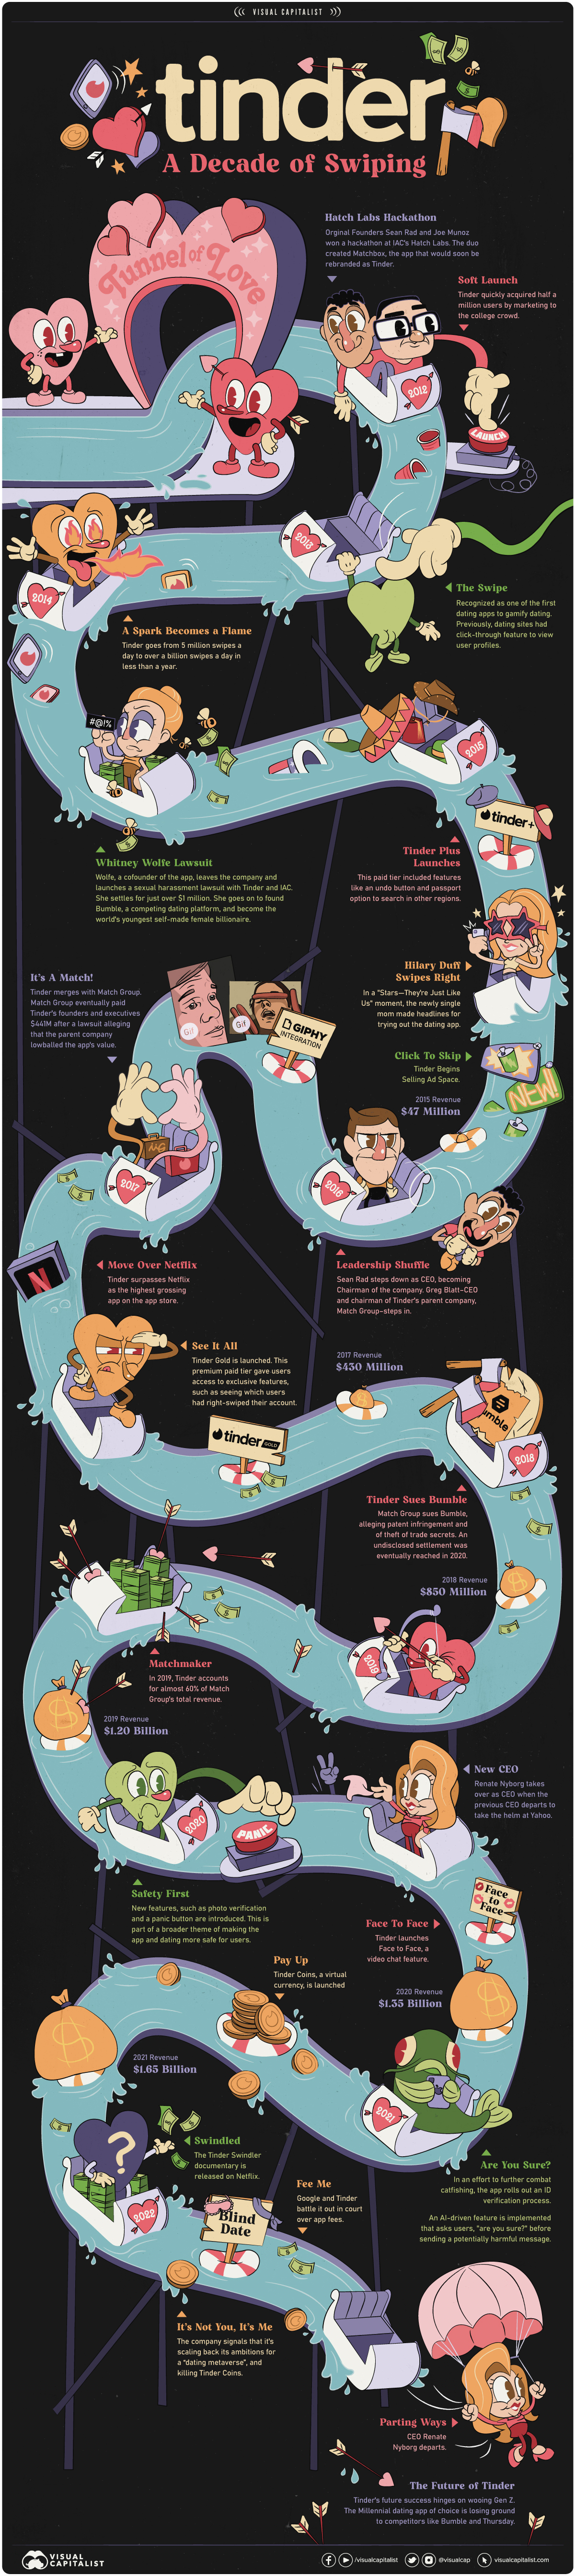


Infographic Timeline: Ten Years of Tinder
A decade of swiping and over half a billion downloads later, Tinder still leads the market share of online dating apps in the United States at 32%.
What started as a “hook-up” app 10 years ago for college students, is now a mainstream hit that is globally used in 190 countries and 45 languages.
The graphic above highlights key moments that have shaped the app’s success, using data from Match Group’s investor presentations and news reports.
From Hatch to Match: The Early Days of Tinder
The concept of the app emerged when the original founding partners, Sean Rad and Joe Munoz, won a hackathon in 2012. Their collaboration lead to the development of Tinder (originally named Matchbox).
Marketing the app to college students was a strategic decision that quickly gained the interest of millennials. This young demographic had been traditionally underserved in the online dating world, and with the global adoption of smartphones, a mobile-only dating app hit the right spot at the right time.
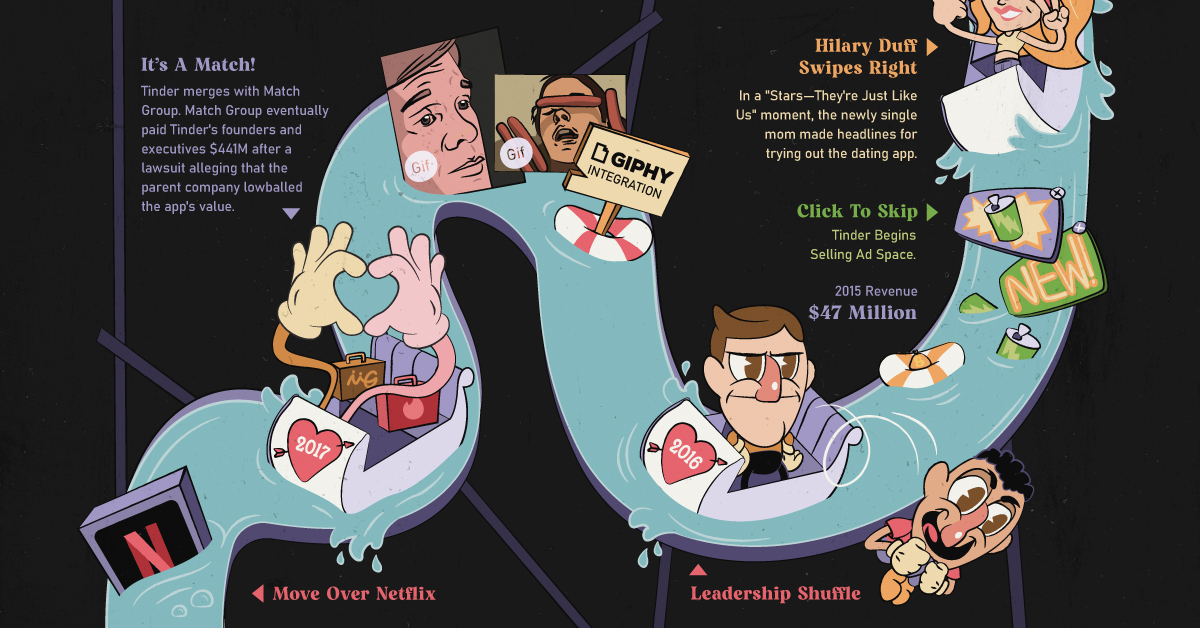
Monetization began in 2015 when premium features became exclusively available for paid users. Annual revenue that year was $47 million and by 2021 that grew to $1.7 billion.
Match Group acquired Tinder in 2017, with a $3 billion valuation. But at the time, very few could predict the stellar run Tinder would have, having risen to become the top dating app in the world and one of the most popular apps overall.
This surge in popularity is also reflected in the financials — Tinder is just one of the 30 dating apps that Match Group owns, but it represents over 50% of their overall revenues. In addition, Tinder is closing in on generating $2 billion per year.
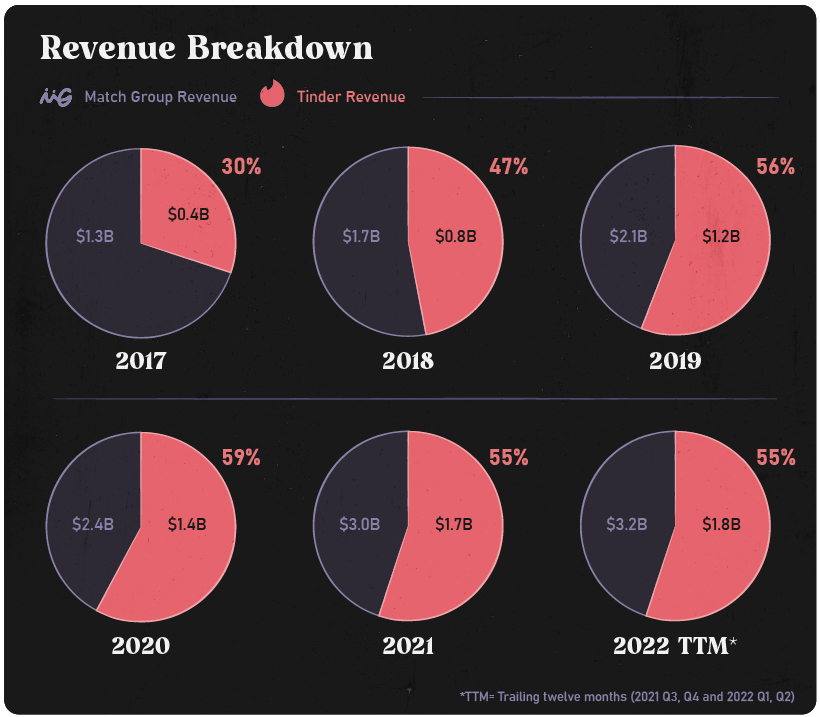
Today, Match Group is worth roughly $17 billion, and by some estimates Tinder is worth around $9 billion, over triple the price of the original acquisition.
Note: Tinder’s value is based on the valuation multiples for online dating companies as well as Tinder’s revenues as a portion of Match Group’s total.
Tinder and Technology
The swipe feature was an integral part of Tinder’s design, and it revolutionized the dating world. Gamifying dating was a novel concept when the feature was introduced back in 2012.
From the 1998 film “You’ve Got Mail” to today’s dopamine-inducing hit of “It’s a Match!,” it’s easy to see the influence technology has on the way we date and mate.
Below is a snapshot of app features that have been driven by technology and culture:
| Year | Technological Feature | Key Business Focus |
|---|---|---|
| 2012 | The “Swipe” | Gamification is the hook |
| 2014 | Tinder Plus | App monetization driven by user experience |
| 2015 | Instagram Integration & Facebook “Common Connections” | Network effects |
| 2017 | Tinder Gold | Power to the user - “Insight to who has liked me” |
| 2019 | Traveler Alert | Putting user safety first |
| 2020 | Panic Button / “Are You Sure?” | Putting user safety first |
| 2021 | Plus One | The pursuit of connections post-covid |
| 2023? | Virtual Exploration - It’s a “Swipe Party” | Understanding the changing demographic |
The Tinder Algorithm
Rating people’s attractiveness can be a controversial subject. Websites like Hot or Not and Mark Zuckerberg’s Facemash are cringe-worthy reminders of the internet’s past.
During the app’s early development, the discovery of a new match relied partially on the “Elo” rating system to score desirability. Attractiveness was evaluated by how often people swiped. The more selective you were with swiping, the higher your attractiveness was rated within the algorithm.
But now according to Tinder’s pressroom:
“Elo is old news at Tinder.”
Instead, Tinder’s algorithmic criteria for profile discovery depends on the users:
- Recent activity – members who are sending likes and nopes
- Profile elements such as the user’s interests
- Location
Tinder now says that proximity is a key factor in how people match on the app.
The Future of Tinder: A Changing Demographic
Today, as the company attempts to target Gen Z, the company’s revenue growth expectations are more lukewarm thanks to shifting cultural preferences,
And keeping the app relevant to a young demographic requires thoughtful consideration that goes beyond just adding new technological features. According to research organization YouthSight, more than 90% of Gen Z’ers report having frustrations with dating apps.
Only time will tell if technological incentives such as features for the metaverse, or virtual coins that further gamify the dating app, are attractive enough for Tinder to compete against the allures of meeting people IRL.


Markets
Ranked: The Largest U.S. Corporations by Number of Employees
We visualized the top U.S. companies by employees, revealing the massive scale of retailers like Walmart, Target, and Home Depot.


The Largest U.S. Corporations by Number of Employees
This was originally posted on our Voronoi app. Download the app for free on Apple or Android and discover incredible data-driven charts from a variety of trusted sources.
Revenue and profit are common measures for measuring the size of a business, but what about employee headcount?
To see how big companies have become from a human perspective, we’ve visualized the top U.S. companies by employees. These figures come from companiesmarketcap.com, and were accessed in March 2024. Note that this ranking includes publicly-traded companies only.
Data and Highlights
The data we used to create this list of largest U.S. corporations by number of employees can be found in the table below.
| Company | Sector | Number of Employees |
|---|---|---|
| Walmart | Consumer Staples | 2,100,000 |
| Amazon | Consumer Discretionary | 1,500,000 |
| UPS | Industrials | 500,000 |
| Home Depot | Consumer Discretionary | 470,000 |
| Concentrix | Information Technology | 440,000 |
| Target | Consumer Staples | 440,000 |
| Kroger | Consumer Staples | 430,000 |
| UnitedHealth | Health Care | 400,000 |
| Berkshire Hathaway | Financials | 383,000 |
| Starbucks | Consumer Discretionary | 381,000 |
| Marriott International | Consumer Discretionary | 377,000 |
| Cognizant | Information Technology | 346,600 |
Retail and Logistics Top the List
Companies like Walmart, Target, and Kroger have a massive headcount due to having many locations spread across the country, which require everything from cashiers to IT professionals.
Moving goods around the world is also highly labor intensive, explaining why UPS has half a million employees globally.
Below the Radar?
Two companies that rank among the largest U.S. corporations by employees which may be less familiar to the public include Concentrix and Cognizant. Both of these companies are B2B brands, meaning they primarily work with other companies rather than consumers. This contrasts with brands like Amazon or Home Depot, which are much more visible among average consumers.
A Note on Berkshire Hathaway
Warren Buffett’s company doesn’t directly employ 383,000 people. This headcount actually includes the employees of the firm’s many subsidiaries, such as GEICO (insurance), Dairy Queen (retail), and Duracell (batteries).
If you’re curious to see how Buffett’s empire has grown over the years, check out this animated graphic that visualizes the growth of Berkshire Hathaway’s portfolio from 1994 to 2022.

-

 Mining2 weeks ago
Charted: The Value Gap Between the Gold Price and Gold Miners
-

 Real Estate1 week ago
Ranked: The Most Valuable Housing Markets in America
-

 Business1 week ago
Charted: Big Four Market Share by S&P 500 Audits
-

 AI1 week ago
The Stock Performance of U.S. Chipmakers So Far in 2024
-

 Misc1 week ago
Almost Every EV Stock is Down After Q1 2024
-

 Money2 weeks ago
Where Does One U.S. Tax Dollar Go?
-

 Green2 weeks ago
Ranked: Top Countries by Total Forest Loss Since 2001
-

 Real Estate2 weeks ago
Visualizing America’s Shortage of Affordable Homes