Markets
Infographic: The Numbers Behind Black Friday
For American retailers, Christmas comes a month earlier.
Starting in late-November, the holiday shopping season officially kicks into high gear – and it’s the beginning of a month-long stretch that can either make or break retailers.
Black Friday is the shotgun start for this mad scramble of consumerism. And whether you are waiting in line to get a Turbo-Man doll, or you are constantly refreshing your browser window for the latest deal on Amazon, it’s a spectacle all the same.
Black Friday Numbers
Today’s infographic comes to us from AppInstitute, and it breaks down the numbers behind Black Friday, the centerpiece of the shopping extravaganza for retailers in the United States.
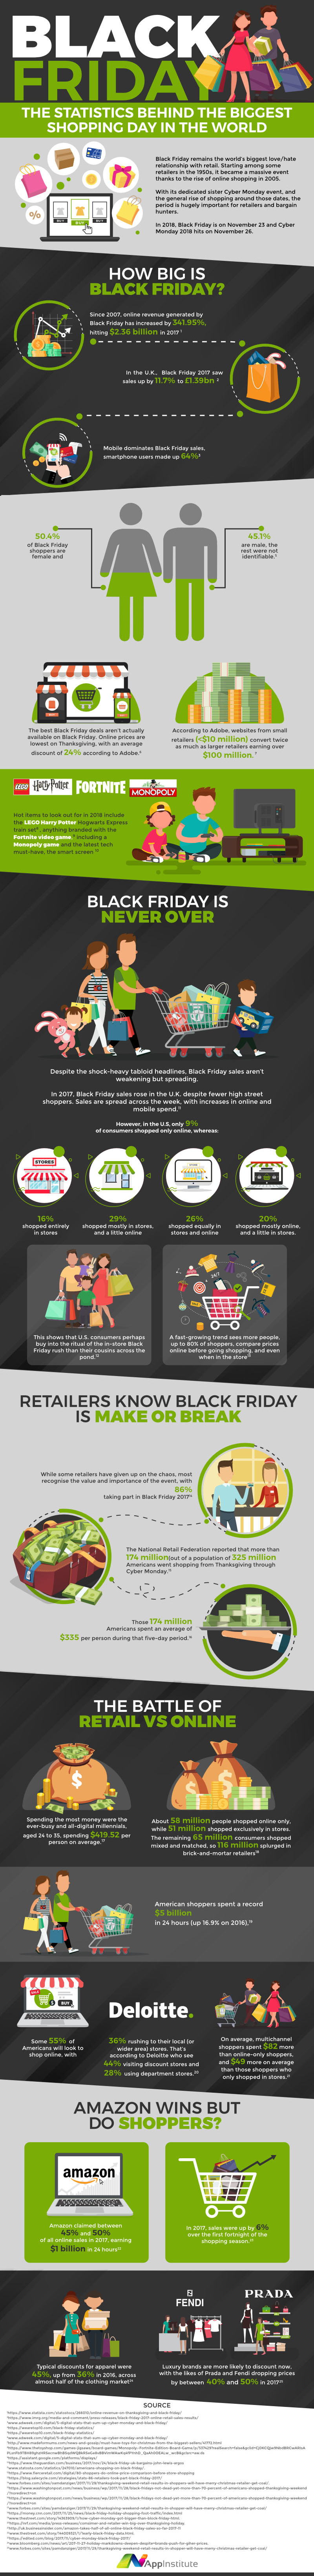
In totality, the holiday season generated $688 billion of revenue for retailers in the United States in 2017 – and $108.2 billion of this came from online purchases, which are seeing double-digit growth each year.
Impressively, about 15% of all online holiday revenue comes in the four-day span between Black Friday and Cyber Monday. The two days (Black Friday, Cyber Monday) are the two highest volume online shopping days of the year.
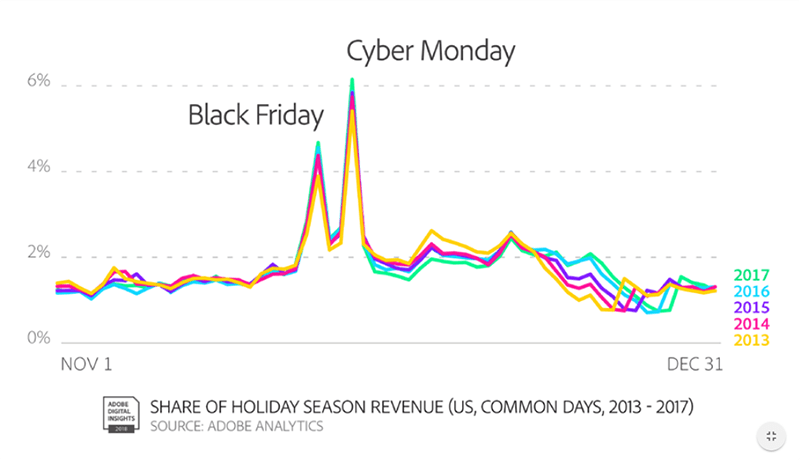
Source: Adobe
Online or Offline
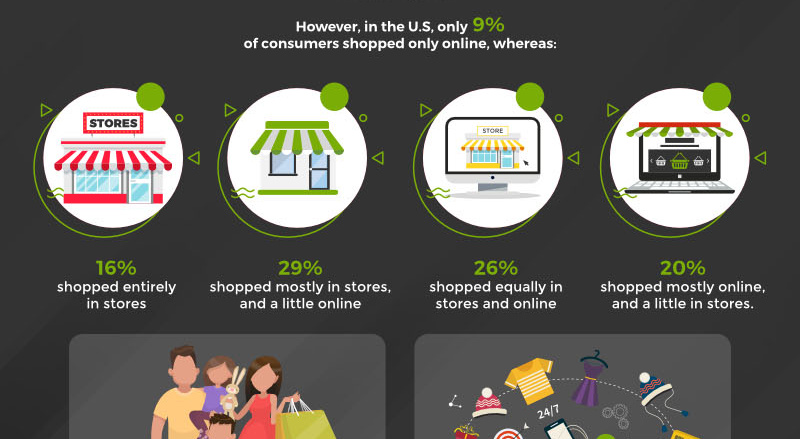
Do shoppers take advantage of deals at home or in store?
It appears to be a mix of both, according to comprehensive data from Adobe for the 2017 shopping season:
- 16% shopped entirely in stores
- 29% shopped mostly in stores, and a little online
- 26% shopped equally in stores and online
- 20% shopped mostly online, and a little in stores
- 9% shopped entirely online
This means for most people, shopping is an omni-channel experience – they are comparing options in their heads between online (desktop, mobile) and offline channels.
An Even Bigger Day For Online Sales
While Black Friday is an impressive kickoff day for online and offline sales, there is an even bigger one-day online equivalent in China.
On Black Friday, online sales total about $5 billion – this is just a drop in the bucket compared to Alibaba’s Single’s Day, which sold $30.8 billion in a 24-hour period on November 11, 2018.
On Single’s Day in 2018, it took fewer than 90 seconds to hit $1 billion in online sales.


Economy
Economic Growth Forecasts for G7 and BRICS Countries in 2024
The IMF has released its economic growth forecasts for 2024. How do the G7 and BRICS countries compare?


G7 & BRICS Real GDP Growth Forecasts for 2024
The International Monetary Fund’s (IMF) has released its real gross domestic product (GDP) growth forecasts for 2024, and while global growth is projected to stay steady at 3.2%, various major nations are seeing declining forecasts.
This chart visualizes the 2024 real GDP growth forecasts using data from the IMF’s 2024 World Economic Outlook for G7 and BRICS member nations along with Saudi Arabia, which is still considering an invitation to join the bloc.
Get the Key Insights of the IMF’s World Economic Outlook
Want a visual breakdown of the insights from the IMF’s 2024 World Economic Outlook report?
This visual is part of a special dispatch of the key takeaways exclusively for VC+ members.
Get the full dispatch of charts by signing up to VC+.
Mixed Economic Growth Prospects for Major Nations in 2024
Economic growth projections by the IMF for major nations are mixed, with the majority of G7 and BRICS countries forecasted to have slower growth in 2024 compared to 2023.
Only three BRICS-invited or member countries, Saudi Arabia, the UAE, and South Africa, have higher projected real GDP growth rates in 2024 than last year.
| Group | Country | Real GDP Growth (2023) | Real GDP Growth (2024P) |
|---|---|---|---|
| G7 | 🇺🇸 U.S. | 2.5% | 2.7% |
| G7 | 🇨🇦 Canada | 1.1% | 1.2% |
| G7 | 🇯🇵 Japan | 1.9% | 0.9% |
| G7 | 🇫🇷 France | 0.9% | 0.7% |
| G7 | 🇮🇹 Italy | 0.9% | 0.7% |
| G7 | 🇬🇧 UK | 0.1% | 0.5% |
| G7 | 🇩🇪 Germany | -0.3% | 0.2% |
| BRICS | 🇮🇳 India | 7.8% | 6.8% |
| BRICS | 🇨🇳 China | 5.2% | 4.6% |
| BRICS | 🇦🇪 UAE | 3.4% | 3.5% |
| BRICS | 🇮🇷 Iran | 4.7% | 3.3% |
| BRICS | 🇷🇺 Russia | 3.6% | 3.2% |
| BRICS | 🇪🇬 Egypt | 3.8% | 3.0% |
| BRICS-invited | 🇸🇦 Saudi Arabia | -0.8% | 2.6% |
| BRICS | 🇧🇷 Brazil | 2.9% | 2.2% |
| BRICS | 🇿🇦 South Africa | 0.6% | 0.9% |
| BRICS | 🇪🇹 Ethiopia | 7.2% | 6.2% |
| 🌍 World | 3.2% | 3.2% |
China and India are forecasted to maintain relatively high growth rates in 2024 at 4.6% and 6.8% respectively, but compared to the previous year, China is growing 0.6 percentage points slower while India is an entire percentage point slower.
On the other hand, four G7 nations are set to grow faster than last year, which includes Germany making its comeback from its negative real GDP growth of -0.3% in 2023.
Faster Growth for BRICS than G7 Nations
Despite mostly lower growth forecasts in 2024 compared to 2023, BRICS nations still have a significantly higher average growth forecast at 3.6% compared to the G7 average of 1%.
While the G7 countries’ combined GDP is around $15 trillion greater than the BRICS nations, with continued higher growth rates and the potential to add more members, BRICS looks likely to overtake the G7 in economic size within two decades.
BRICS Expansion Stutters Before October 2024 Summit
BRICS’ recent expansion has stuttered slightly, as Argentina’s newly-elected president Javier Milei declined its invitation and Saudi Arabia clarified that the country is still considering its invitation and has not joined BRICS yet.
Even with these initial growing pains, South Africa’s Foreign Minister Naledi Pandor told reporters in February that 34 different countries have submitted applications to join the growing BRICS bloc.
Any changes to the group are likely to be announced leading up to or at the 2024 BRICS summit which takes place October 22-24 in Kazan, Russia.
Get the Full Analysis of the IMF’s Outlook on VC+
This visual is part of an exclusive special dispatch for VC+ members which breaks down the key takeaways from the IMF’s 2024 World Economic Outlook.
For the full set of charts and analysis, sign up for VC+.

-

 Markets1 week ago
U.S. Debt Interest Payments Reach $1 Trillion
-

 Business2 weeks ago
Charted: Big Four Market Share by S&P 500 Audits
-

 Real Estate2 weeks ago
Ranked: The Most Valuable Housing Markets in America
-

 Money2 weeks ago
Which States Have the Highest Minimum Wage in America?
-

 AI2 weeks ago
Ranked: Semiconductor Companies by Industry Revenue Share
-

 Markets2 weeks ago
Ranked: The World’s Top Flight Routes, by Revenue
-

 Demographics2 weeks ago
Population Projections: The World’s 6 Largest Countries in 2075
-

 Markets2 weeks ago
The Top 10 States by Real GDP Growth in 2023