Energy
The Inflation Factor: How Rising Food and Energy Prices Impact the Economy
![]() Subscribe to the Elements free mailing list for more like this
Subscribe to the Elements free mailing list for more like this
How Rising Food and Energy Prices Impact the Economy
This was originally posted on Elements. Sign up to the free mailing list to get beautiful visualizations on natural resource megatrends in your email every week.
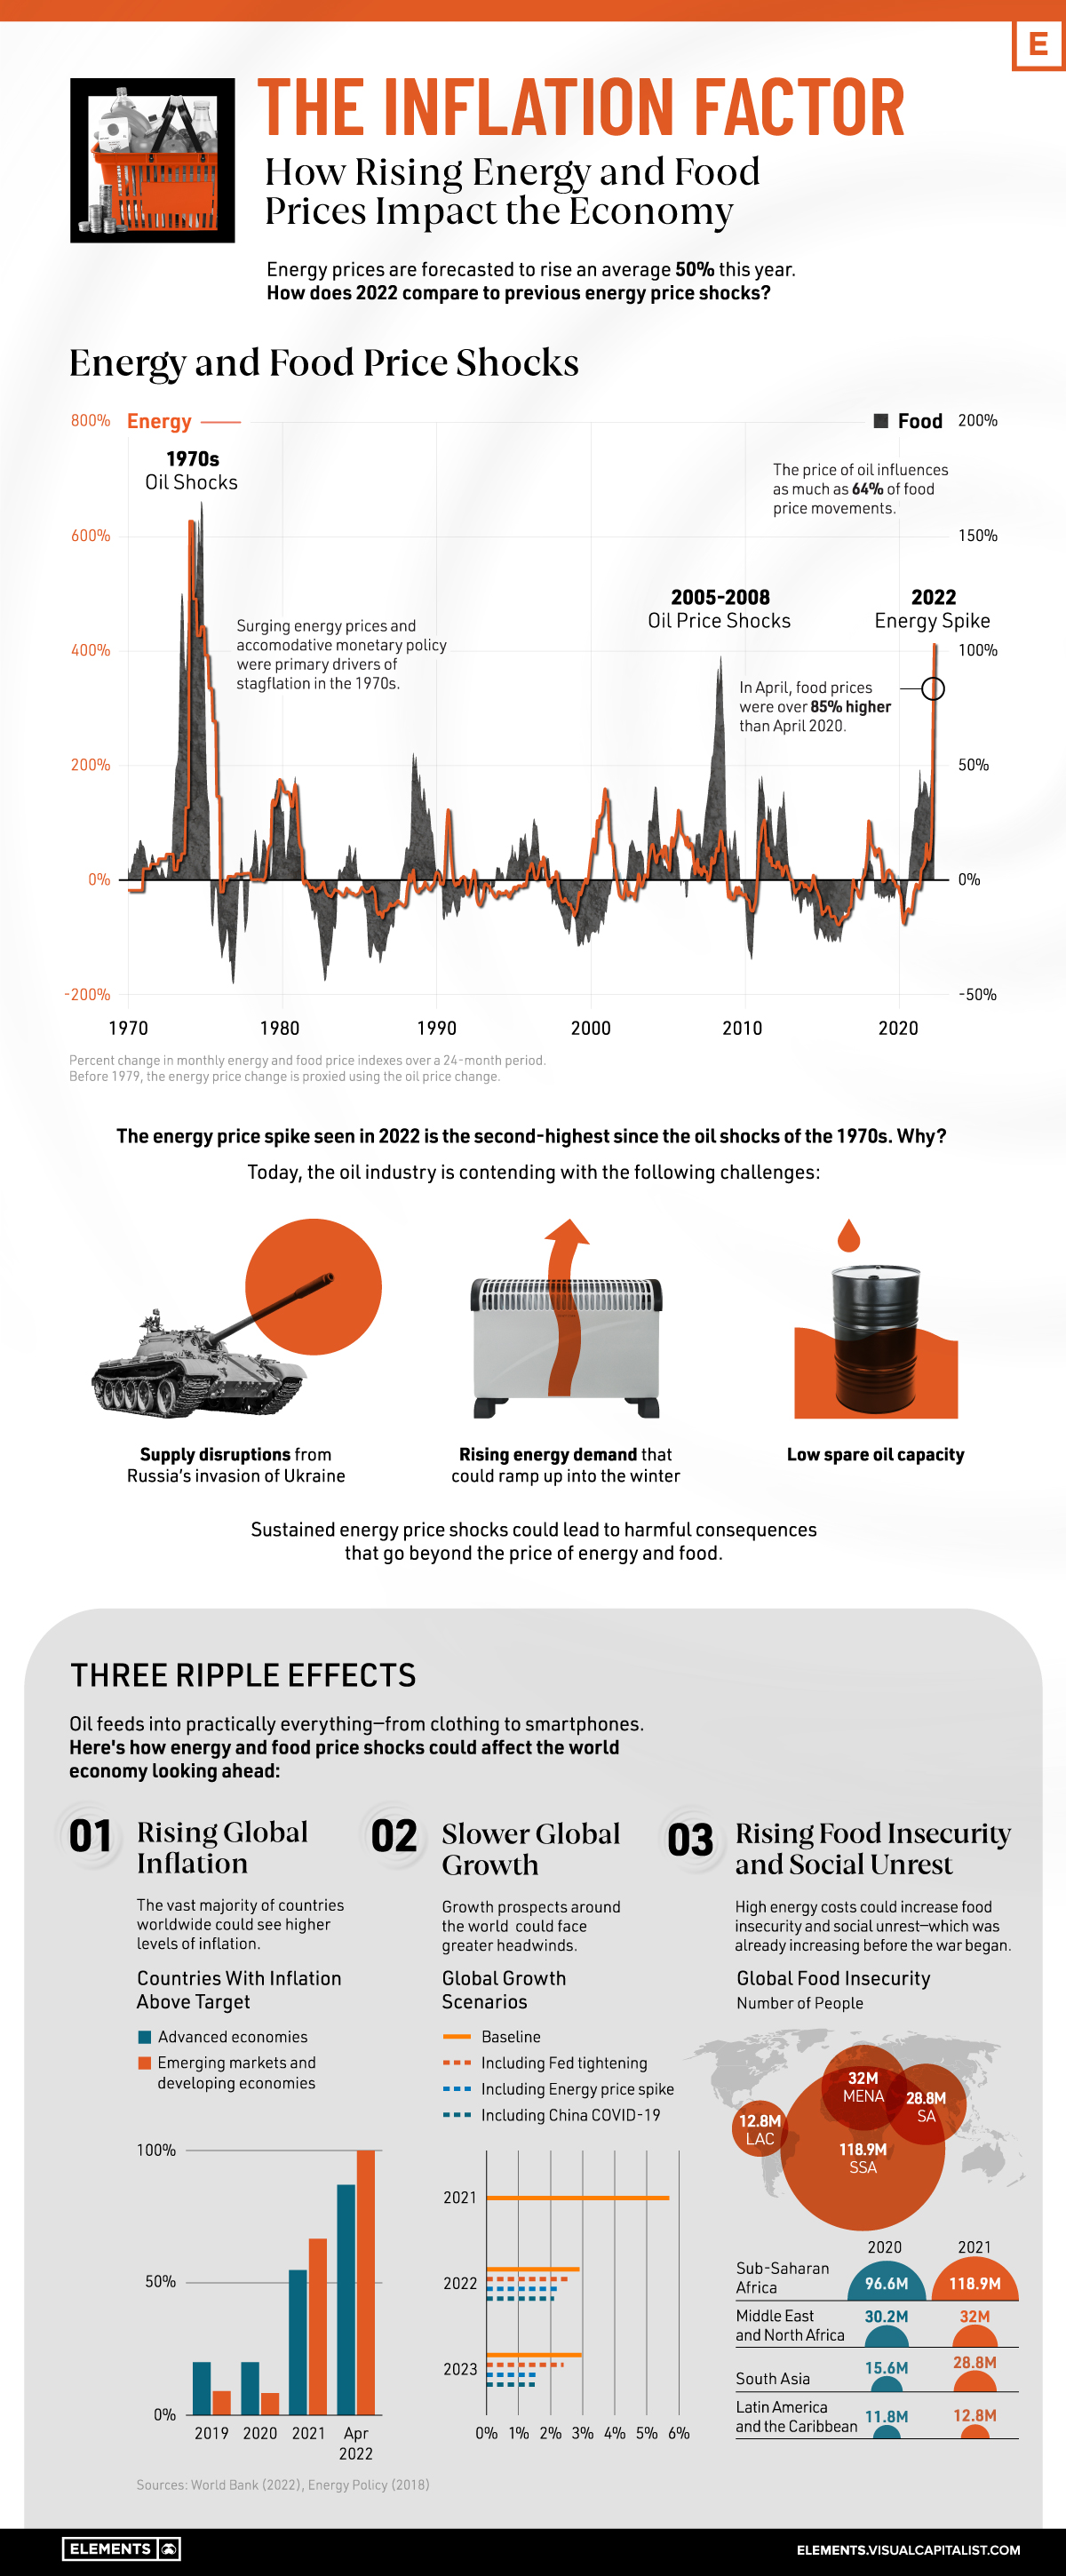
Since Russia’s invasion of Ukraine, the effects of energy supply disruptions are cascading across everything from food prices to electricity to consumer sentiment.
In response to soaring prices, many OECD countries are tapping into their strategic petroleum reserves. In fact, since March, the U.S. has sold a record one million barrels of oil per day from these reserves. This, among other factors, has led gasoline prices to fall more recently—yet deficits could follow into 2023, causing prices to increase.
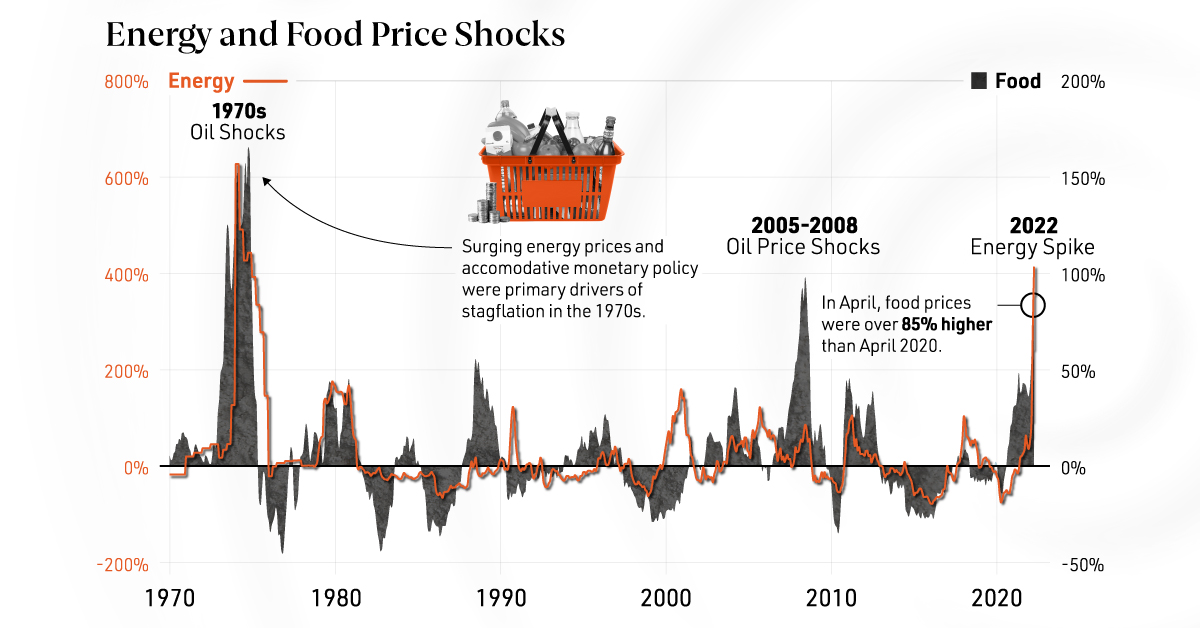
With data from the World Bank, the above infographic charts energy shocks over the last half century and what this means for the global economy looking ahead.
Energy Price Shocks Since 1979
How does today’s energy price shock compare to previous spikes in real terms?
| U.S.$/bbl Equivalent | Crude Oil | Natural Gas | Coal |
|---|---|---|---|
| 2022* | $93 | $170 | $61 |
| 2008 | $127 | $100 | $46 |
| 1979 | $119 | $72 | $33 |
*2022 forecast
As the above table shows, the annual price of crude oil is forecasted to average $93 per barrel equivalent in 2022. By comparison, during the 2008 and 1979 price shocks, crude oil averaged $127 and $119 per barrel, respectively.
What distinguishes the 2022 energy spike is that prices have soared across all fuels. Where price shocks were more or less isolated in the past, many countries such as Germany and the Netherlands are looking to coal to make up for oil supply disruptions. Meanwhile, European natural gas prices have hit record highs.
Food prices have also spiked. Driven by higher input costs across fuel, chemicals, and fertilizer, agriculture commodity prices are forecasted to rise 18% in 2022. Fertilizer prices alone could increase 70% in part due to Russia’s dominance of the global fertilizer market—exporting more than any country worldwide.
What are 3 Ripple Effects of Rising Energy Prices?
Oil feeds into nearly everything, from food to smartphones. In fact, the price of oil influences as much as 64% of food price movements.
How could energy and food shocks affect the world economy in the near future, and why is a lot riding on the price of oil?
1. Rising Global Inflation
In 2022, inflation became a global phenomenon—impacting 100% of advanced countries and 87% of emerging markets and developing economies analyzed by the World Bank.
| Countries With Inflation Above Target | 2019 | 2020 | 2021 | Apr 2022 |
|---|---|---|---|---|
| Emerging Markets and Developing Economies | 20% | 20% | 55% | 87% |
| Advanced Economies | 9% | 8% | 67% | 100% |
Sample includes 31 emerging markets and developing economies and 12 advanced economies
By contrast, roughly two-thirds of advanced economies and just over half of emerging markets experienced inflation above target in 2021.
This has contributed to tighter monetary conditions. The table below shows how rising inflation in the U.S. has corresponded with interest rate hikes since the 1980s:
| Date | Core CPI at Beginning of Cycle | Magnitude of Rate Hikes Over Course of Tightening Cycle |
|---|---|---|
| 1979-81 | 9.3% | 9.0 p.p |
| 1983-84 | 4.6% | 3.0 p.p |
| 1986-89 | 3.6% | 4.0 p.p |
| 1994-95 | 2.8% | 3.0 p.p |
| 1999-00 | 2.0% | 1.75 p.p |
| 2004-06 | 1.9% | 4.25 p.p. |
| 2015-19 | 2.1% | 2.25 p.p |
| 2022-23 | 6.4% | 2.75 p.p |
2023 is an estimate based on market expectations of the level of the Fed Funds rate in mid-2023. U.S. Core CPI for 2023 based on latest data available.
In many cases, when the U.S. has rapidly tightened monetary policy in response to price pressures, emerging markets and developing economies have experienced financial crises amid higher borrowing costs.
2. Slower Global Growth
Energy price shocks could add greater headwinds to global growth prospects:
| Global Growth Scenarios | 2021 | 2022 | 2023 |
|---|---|---|---|
| Baseline | 5.7% | 2.9% | 3.0% |
| Including Fed tightening | 2.6% | 2.4% | |
| Including Energy price spike | 2.2% | 1.6% | |
| Including China COVID-19 | 2.1% | 1.5% |
Together, price spikes, hawkish monetary policy, and COVID-19 lockdowns in China could negatively impact global growth.
3. Rising Food Insecurity and Social Unrest
Even before the energy price shock of 2022, global food insecurity was increasing due to COVID-19 and mounting inflationary pressures.
| Number of People in Acute Food Insecurity | 2020 | 2021 |
|---|---|---|
| Sub-Saharan Africa | 97M | 119M |
| Middle East and North Africa | 30M | 32M |
| South Asia | 16M | 29M |
| Latin America and the Caribbean | 12M | 13M |
Sustained food shortages and high food prices could send millions into acute food insecurity.
In addition, high fuel and food prices are often correlated with mass protests, political violence, and riots. While Sri Lanka and Peru have already begun to see heightened riots, Turkey and Egypt are also at risk for social unrest as the cost of living accelerates and food insecurity worsens.
Global Challenges
Since World War II, oil price shocks have been a major constraint on economic growth. As the war in Ukraine continues, the outlook for today’s energy market is far from clear as a number of geopolitical factors could sway oil price movements and its corresponding effects.


Energy
The World’s Biggest Nuclear Energy Producers
China has grown its nuclear capacity over the last decade, now ranking second on the list of top nuclear energy producers.


The World’s Biggest Nuclear Energy Producers
This was originally posted on our Voronoi app. Download the app for free on Apple or Android and discover incredible data-driven charts from a variety of trusted sources.
Scientists in South Korea recently broke a record in a nuclear fusion experiment. For 48 seconds, they sustained a temperature seven times that of the sun’s core.
But generating commercially viable energy from nuclear fusion still remains more science fiction than reality. Meanwhile, its more reliable sibling, nuclear fission, has been powering our world for many decades.
In this graphic, we visualized the top producers of nuclear energy by their share of the global total, measured in terawatt hours (TWh). Data for this was sourced from the Nuclear Energy Institute, last updated in August 2022.
Which Country Generates the Most Nuclear Energy?
Nuclear energy production in the U.S. is more than twice the amount produced by China (ranked second) and France (ranked third) put together. In total, the U.S. accounts for nearly 30% of global nuclear energy output.
However, nuclear power only accounts for one-fifth of America’s electricity supply. This is in contrast to France, which generates 60% of its electricity from nuclear plants.
| Rank | Country | Nuclear Energy Produced (TWh) | % of Total |
|---|---|---|---|
| 1 | 🇺🇸 U.S. | 772 | 29% |
| 2 | 🇨🇳 China | 383 | 14% |
| 3 | 🇫🇷 France | 363 | 14% |
| 4 | 🇷🇺 Russia | 208 | 8% |
| 5 | 🇰🇷 South Korea | 150 | 6% |
| 6 | 🇨🇦 Canada | 87 | 3% |
| 7 | 🇺🇦 Ukraine | 81 | 3% |
| 8 | 🇩🇪 Germany | 65 | 2% |
| 9 | 🇯🇵 Japan | 61 | 2% |
| 10 | 🇪🇸 Spain | 54 | 2% |
| 11 | 🇸🇪 Sweden | 51 | 2% |
| 12 | 🇧🇪 Belgium | 48 | 2% |
| 13 | 🇬🇧 UK | 42 | 2% |
| 14 | 🇮🇳 India | 40 | 2% |
| 15 | 🇨🇿 Czech Republic | 29 | 1% |
| N/A | 🌐 Other | 219 | 8% |
| N/A | 🌍 Total | 2,653 | 100% |
Another highlight is how China has rapidly grown its nuclear energy capabilities in the last decade. Between 2016 and 2021, for example, it increased its share of global nuclear energy output from less than 10% to more than 14%, overtaking France for second place.
On the opposite end, the UK’s share has slipped to 2% over the same time period.
Meanwhile, Ukraine has heavily relied on nuclear energy to power its grid. In March 2022, it lost access to its key Zaporizhzhia Nuclear Power Station after Russian forces wrested control of the facility. With six 1,000 MW reactors, the plant is one of the largest in Europe. It is currently not producing any power, and has been the site of recent drone attacks.

-

 Mining2 weeks ago
Charted: The Value Gap Between the Gold Price and Gold Miners
-

 Real Estate1 week ago
Ranked: The Most Valuable Housing Markets in America
-

 Business1 week ago
Charted: Big Four Market Share by S&P 500 Audits
-

 AI1 week ago
The Stock Performance of U.S. Chipmakers So Far in 2024
-

 Misc1 week ago
Almost Every EV Stock is Down After Q1 2024
-

 Money2 weeks ago
Where Does One U.S. Tax Dollar Go?
-

 Green2 weeks ago
Ranked: Top Countries by Total Forest Loss Since 2001
-

 Real Estate2 weeks ago
Visualizing America’s Shortage of Affordable Homes