Markets
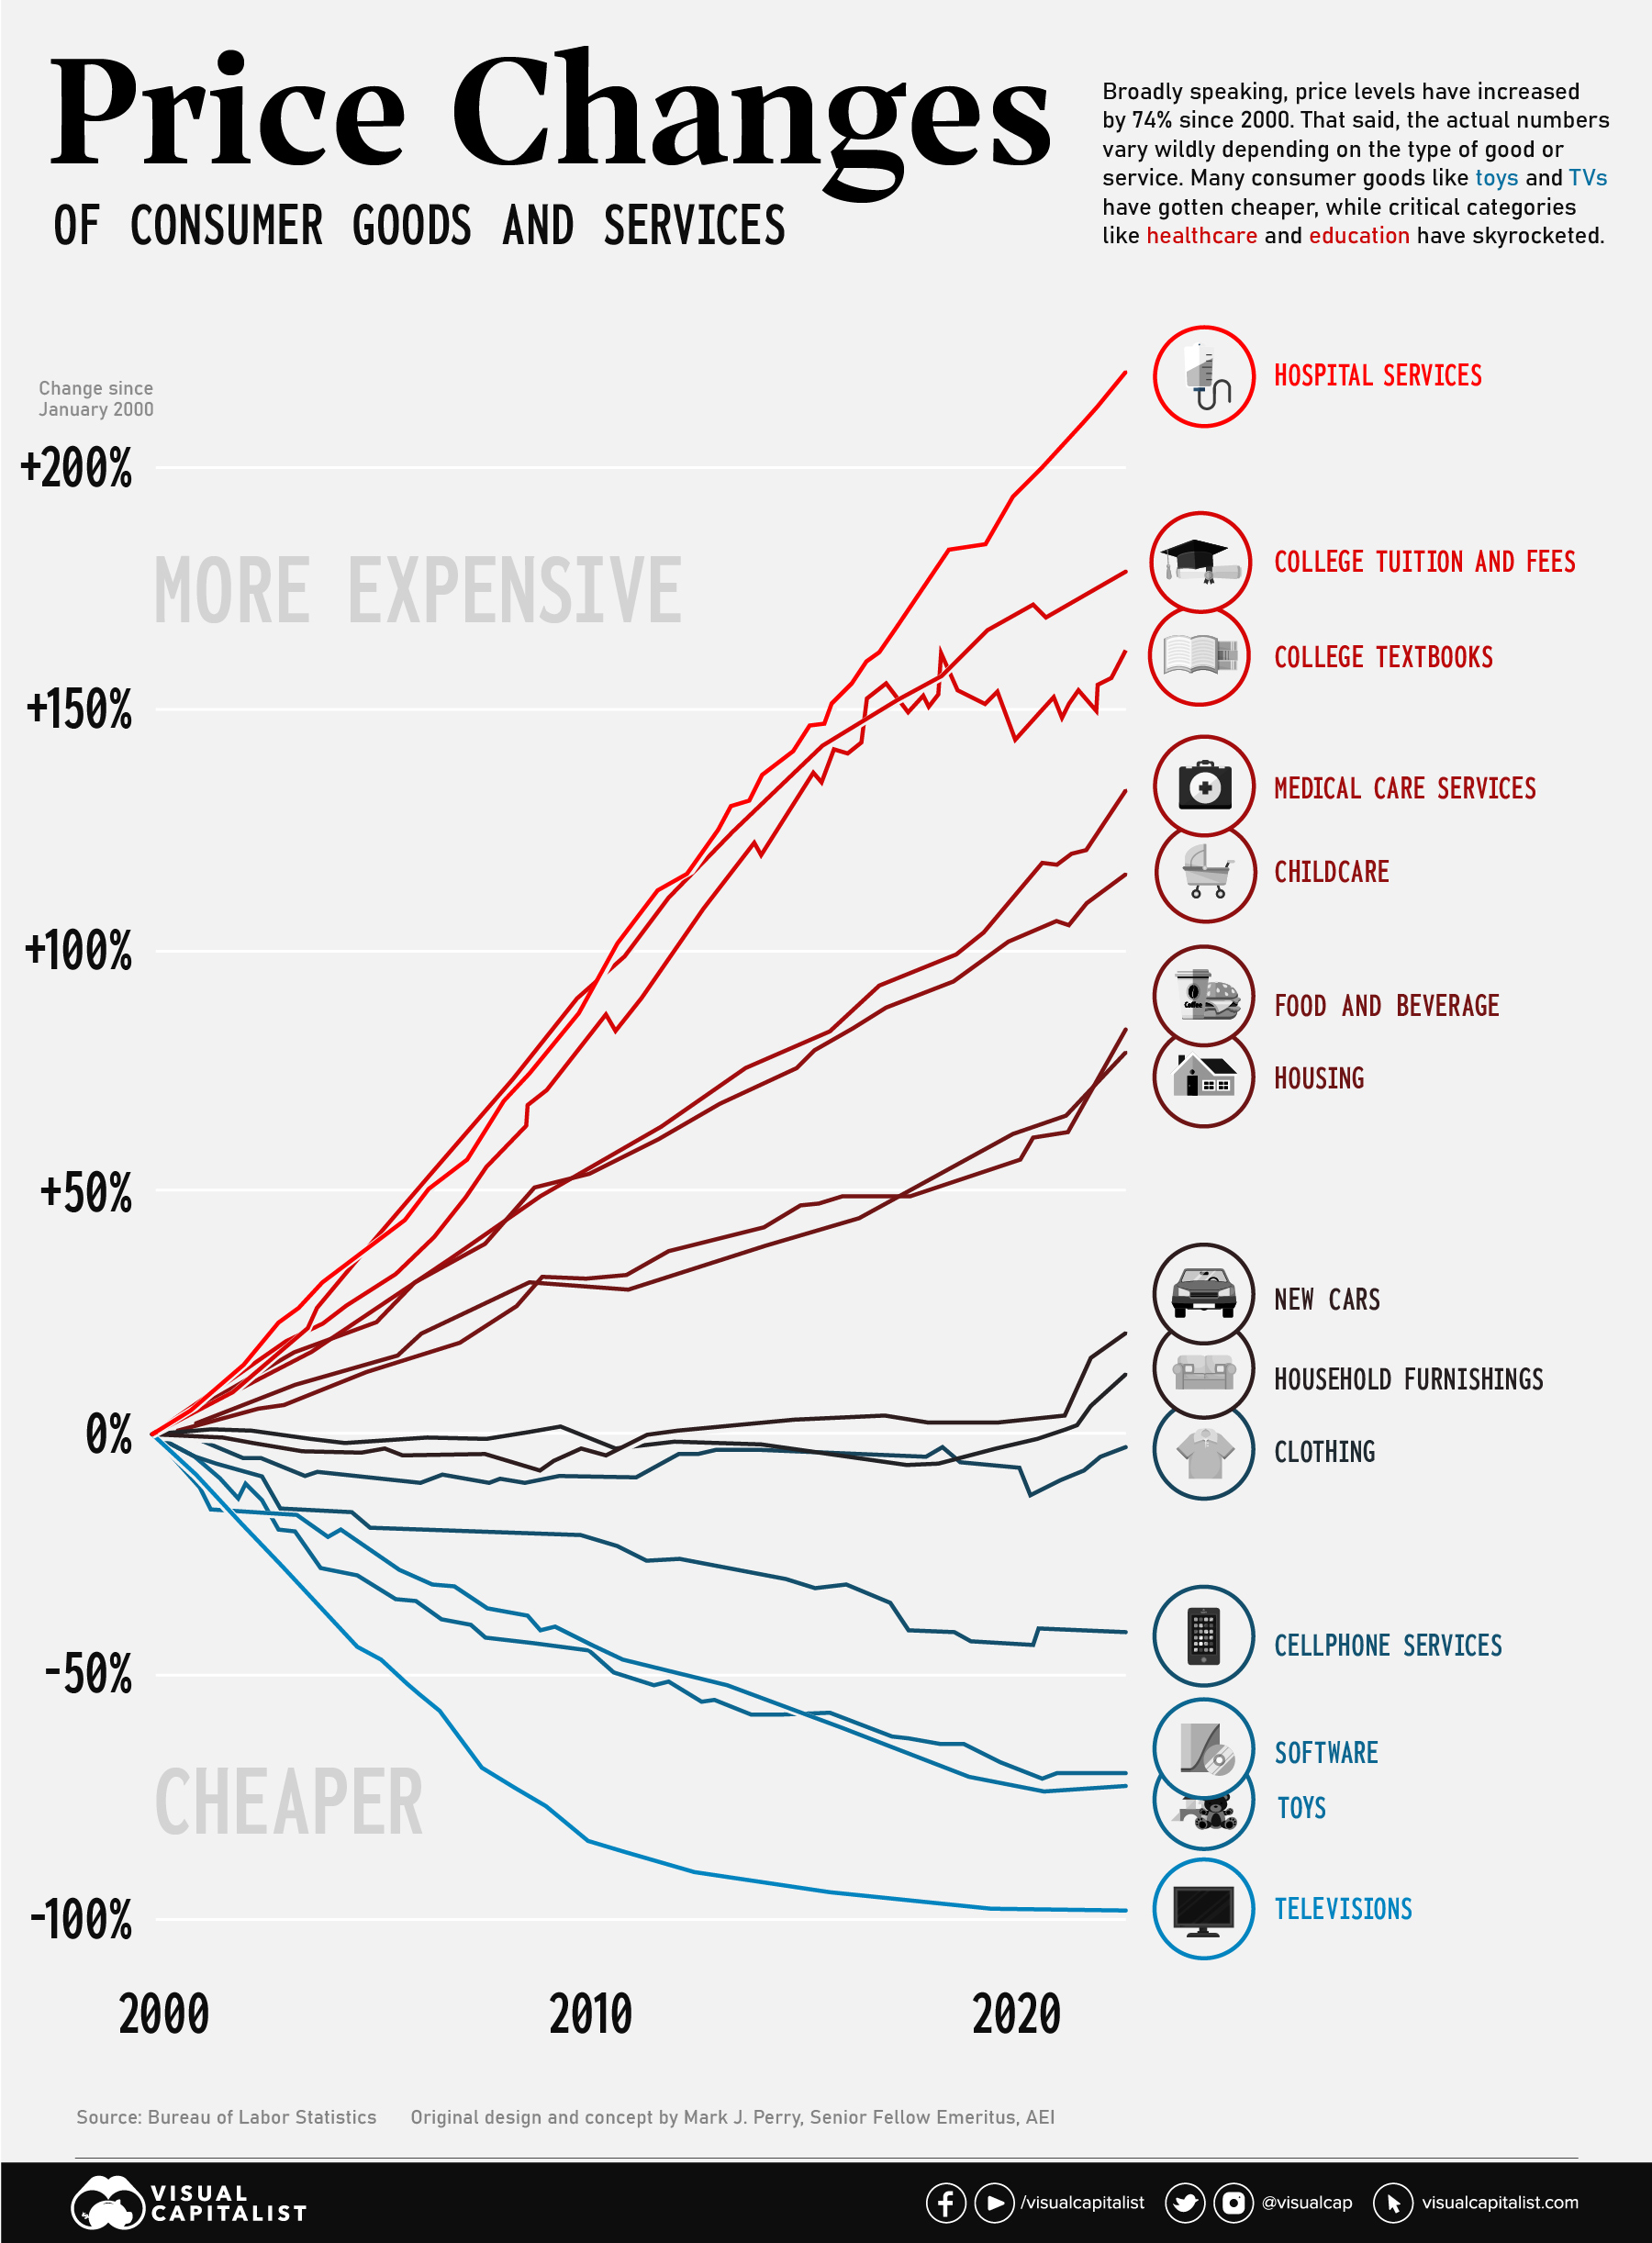
Consumer Price Inflation, by Type of Good or Service (2000-2022)
Consumer Price Inflation, by Type of Good or Service (2000-2022)
The Consumer Price Index (CPI) provides a steady indication of how inflation is affecting the economy. This big picture number is useful for policymakers and professionals in the financial sector, but most people experience inflation at the cash register or checkout screen.
Since the start of the 21st century, U.S. consumers have seen a divergence of price movements across various categories. Nowhere is this better illustrated than on this chart concept thought up by AEI’s Mark J. Perry. It’s sometimes referred to as the “chart of the century” because it provides such a clear and impactful jump-off point to discuss a number of economic forces.
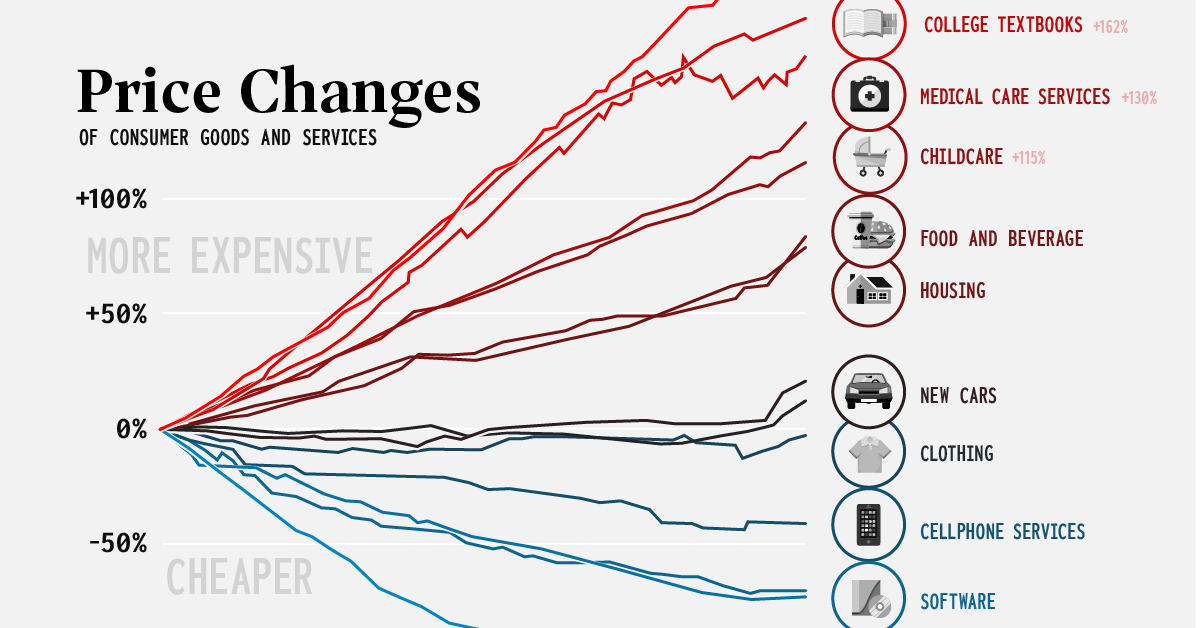
The punchline is that many consumer goods—particularly those that were easily outsourced—saw price drops, while key “non-tradable” categories saw massive increases. We’ll look at both situations in more detail below.
Race to the Top: Inflation in Healthcare and Education
Since the beginning of this century, two types of essential categories have been marching steadily upward in price: healthcare and education.
America has a well documented “medical inflation” issue. There are a number of reasons why costs in the healthcare sector keep rising, including rising labor costs, an aging population, better technology, and medical tourism. The pricing of pharmaceutical products and hospital services are also a major contributor to increases. As Barry Ritholtz has diplomatically stated, “market forces don’t work very well in this industry”.
Rising medical costs have serious consequences for the U.S. population. Recent data indicates that half of Americans now carry medical debt, with the majority owing $1,000 or more.
Also near the top of the chart are education-related categories. In the ’60s and ’70s, tuition roughly tracked with inflation, but that began to change in the mid-1980s. Since then, tuition costs have marched ever upward. Since 2000, tuition prices have increased by 178% and college textbooks have jumped 162%.
As usual, low income students are disproportionally impacted by rising tuition. Pell Grants now cover a much smaller portion of tuition than they used to, and the majority of states have cut funding to higher education in recent years.
Globalization: A Tale of Televisions and Toys
Even though essentials like education and heathcare have rocketed up, it’s not all bad news. Consumers have seen the price of some goods and services drop dramatically.
Flat screen televisions used to be a big ticket item. At the turn of the century, a flat screen TV would cost around 17% of the median income of the time ($42,148). In the early aughts though, prices began to fall quickly. Today, a new TV will cost less than 1% of the U.S. median income ($54,132).
Similarly, cellular services and software have gotten cheaper over the past two decades as well. Toys are another prime example. Not only are most toys manufactured overseas, the value proposition has changed as children have new digital options to entertain themselves with.
Over a long-term perspective, items like clothing and household furnishings have remained relatively flat in price, even after the most recent bout of inflation.


Economy
Economic Growth Forecasts for G7 and BRICS Countries in 2024
The IMF has released its economic growth forecasts for 2024. How do the G7 and BRICS countries compare?


G7 & BRICS Real GDP Growth Forecasts for 2024
The International Monetary Fund’s (IMF) has released its real gross domestic product (GDP) growth forecasts for 2024, and while global growth is projected to stay steady at 3.2%, various major nations are seeing declining forecasts.
This chart visualizes the 2024 real GDP growth forecasts using data from the IMF’s 2024 World Economic Outlook for G7 and BRICS member nations along with Saudi Arabia, which is still considering an invitation to join the bloc.
Get the Key Insights of the IMF’s World Economic Outlook
Want a visual breakdown of the insights from the IMF’s 2024 World Economic Outlook report?
This visual is part of a special dispatch of the key takeaways exclusively for VC+ members.
Get the full dispatch of charts by signing up to VC+.
Mixed Economic Growth Prospects for Major Nations in 2024
Economic growth projections by the IMF for major nations are mixed, with the majority of G7 and BRICS countries forecasted to have slower growth in 2024 compared to 2023.
Only three BRICS-invited or member countries, Saudi Arabia, the UAE, and South Africa, have higher projected real GDP growth rates in 2024 than last year.
| Group | Country | Real GDP Growth (2023) | Real GDP Growth (2024P) |
|---|---|---|---|
| G7 | 🇺🇸 U.S. | 2.5% | 2.7% |
| G7 | 🇨🇦 Canada | 1.1% | 1.2% |
| G7 | 🇯🇵 Japan | 1.9% | 0.9% |
| G7 | 🇫🇷 France | 0.9% | 0.7% |
| G7 | 🇮🇹 Italy | 0.9% | 0.7% |
| G7 | 🇬🇧 UK | 0.1% | 0.5% |
| G7 | 🇩🇪 Germany | -0.3% | 0.2% |
| BRICS | 🇮🇳 India | 7.8% | 6.8% |
| BRICS | 🇨🇳 China | 5.2% | 4.6% |
| BRICS | 🇦🇪 UAE | 3.4% | 3.5% |
| BRICS | 🇮🇷 Iran | 4.7% | 3.3% |
| BRICS | 🇷🇺 Russia | 3.6% | 3.2% |
| BRICS | 🇪🇬 Egypt | 3.8% | 3.0% |
| BRICS-invited | 🇸🇦 Saudi Arabia | -0.8% | 2.6% |
| BRICS | 🇧🇷 Brazil | 2.9% | 2.2% |
| BRICS | 🇿🇦 South Africa | 0.6% | 0.9% |
| BRICS | 🇪🇹 Ethiopia | 7.2% | 6.2% |
| 🌍 World | 3.2% | 3.2% |
China and India are forecasted to maintain relatively high growth rates in 2024 at 4.6% and 6.8% respectively, but compared to the previous year, China is growing 0.6 percentage points slower while India is an entire percentage point slower.
On the other hand, four G7 nations are set to grow faster than last year, which includes Germany making its comeback from its negative real GDP growth of -0.3% in 2023.
Faster Growth for BRICS than G7 Nations
Despite mostly lower growth forecasts in 2024 compared to 2023, BRICS nations still have a significantly higher average growth forecast at 3.6% compared to the G7 average of 1%.
While the G7 countries’ combined GDP is around $15 trillion greater than the BRICS nations, with continued higher growth rates and the potential to add more members, BRICS looks likely to overtake the G7 in economic size within two decades.
BRICS Expansion Stutters Before October 2024 Summit
BRICS’ recent expansion has stuttered slightly, as Argentina’s newly-elected president Javier Milei declined its invitation and Saudi Arabia clarified that the country is still considering its invitation and has not joined BRICS yet.
Even with these initial growing pains, South Africa’s Foreign Minister Naledi Pandor told reporters in February that 34 different countries have submitted applications to join the growing BRICS bloc.
Any changes to the group are likely to be announced leading up to or at the 2024 BRICS summit which takes place October 22-24 in Kazan, Russia.
Get the Full Analysis of the IMF’s Outlook on VC+
This visual is part of an exclusive special dispatch for VC+ members which breaks down the key takeaways from the IMF’s 2024 World Economic Outlook.
For the full set of charts and analysis, sign up for VC+.

-

 Markets1 week ago
U.S. Debt Interest Payments Reach $1 Trillion
-

 Business2 weeks ago
Charted: Big Four Market Share by S&P 500 Audits
-

 Markets2 weeks ago
Ranked: The Most Valuable Housing Markets in America
-

 Money2 weeks ago
Which States Have the Highest Minimum Wage in America?
-

 AI2 weeks ago
Ranked: Semiconductor Companies by Industry Revenue Share
-

 Markets2 weeks ago
Ranked: The World’s Top Flight Routes, by Revenue
-

 Countries2 weeks ago
Population Projections: The World’s 6 Largest Countries in 2075
-

 Markets2 weeks ago
The Top 10 States by Real GDP Growth in 2023