Misc
Infection Trajectory: See Which Countries are Flattening Their COVID-19 Curve
NOTE: This chart updates daily with new data. Also, the search button in the lower–left corner allows filtering of specific countries.
At the outset of 2020, the world looked on as China grappled with an outbreak that seemed be spiraling out of control.
Two months later, the situation is markedly different. After aggressive testing and quarantine efforts, China’s outbreak of Novel Coronavirus (COVID-19) appears to be leveling off.
Now, numerous countries around the world are in the beginning stages of managing their own outbreaks. March 15th, 2020, marked a significant statistical milestone for this, as confirmed cases of COVID-19 outside of China surpassed the Chinese total.
The tracker above, by Our World in Data, charts the trajectory of the growing number of countries with more than 100 confirmed cases of COVID-19. As the number of new infections reported around the world continues to grow, which countries are winning the battle against COVID-19, and which are still struggling to slow the rate of infection?
What’s Your National Infection Trajectory?
As of publishing time, 39 countries have passed the threshold of 100 confirmed cases, with many more countries on the cusp. By comparing infection trajectories from the 100 case mark, we’re able to see a clearer picture of how quickly the virus is spreading within various countries.
A rapid “doubling rate” can spell big trouble, as even countries with advanced healthcare systems can become overwhelmed by the sheer number of cases. This was the case in the Lombardy region of Italy, where hospitals were overloaded and an increasing number of medical staff are under quarantine after testing positive for the virus. Nearly 10% of COVID-19 patients in Lombardy required intensive care, which stretched resources to their breaking point.
Other countries are looking to avoid this situation by “flattening the curve” of the pandemic. In other words, preventing and delaying the spread of the virus so that large portions of the population aren’t sick at the same time.
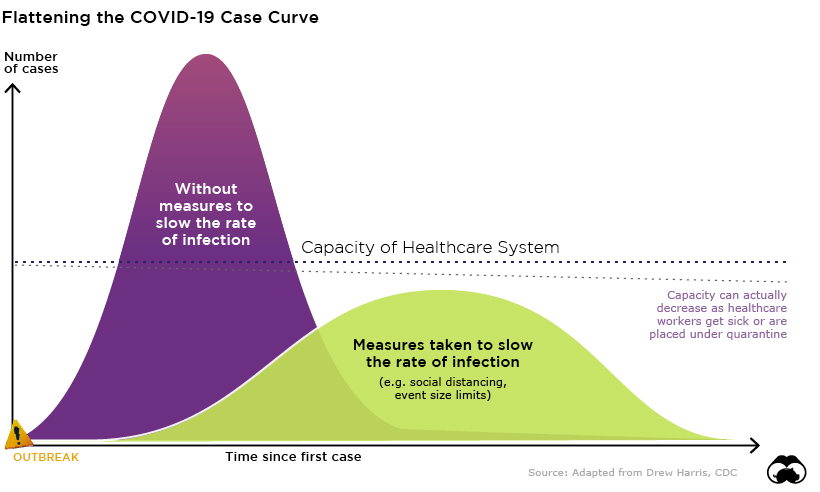
Original concept by Drew Harris
Everything’s Canceled
While all the countries on this tracker are united behind a common goal – stamping out COVID-19 as soon as possible – each country has its own approach and unique challenges when it comes to keeping their population safe. Of course, countries that are just beginning to experience exponential growth in case numbers have the benefit of learning from mistakes made elsewhere, and adopting ideas that are proving successful at slowing the rate of infection.
Many jurisdictions are implementing some or all of these measures to help flatten the curve:
- Quarantining
- Encouraging social distancing
- Encouraging working from home
- Closing schools and other institutions
- Placing hard limits on the size of crowds at events
The following chart explains why this last measure is critical to limiting the spread of the virus.
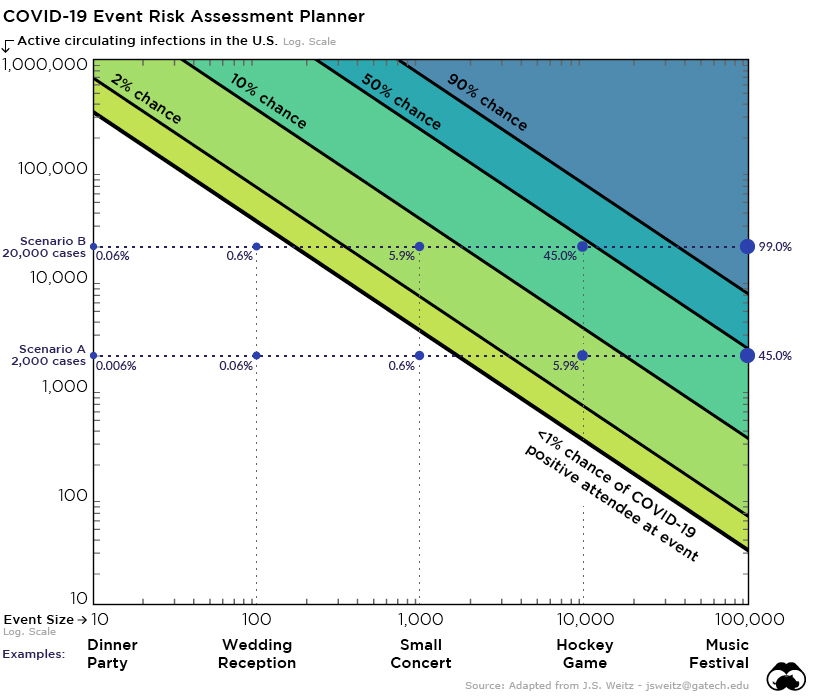
View the interactive Event Risk Assessment Tool here.
In scenario B above, which assumes just 20,000 active cases of COVID-19 in the U.S., there’s nearly a 50% chance an infected person will be attending a 10,000 person conference or sporting event. This is precisely the reason why temporary limits on crowd size are popping up in many jurisdictions around the world.
Direct losses due to canceled tech conferences alone, such as SXSW and the Electronic Entertainment Expo, have already surpassed the $1 billion mark, but despite the short-term economic pain of cancellations and decreased entertainment spending, the costs of business-as-usual could be incalculable.


Maps
The Largest Earthquakes in the New York Area (1970-2024)
The earthquake that shook buildings across New York in April 2024 was the third-largest quake in the Northeast U.S. over the past 50 years.


The Largest Earthquakes in the New York Area
This was originally posted on our Voronoi app. Download the app for free on Apple or Android and discover incredible data-driven charts from a variety of trusted sources.
The 4.8 magnitude earthquake that shook buildings across New York on Friday, April 5th, 2024 was the third-largest quake in the U.S. Northeast area over the past 50 years.
In this map, we illustrate earthquakes with a magnitude of 4.0 or greater recorded in the Northeastern U.S. since 1970, according to the United States Geological Survey (USGS).
Shallow Quakes and Older Buildings
The earthquake that struck the U.S. Northeast in April 2024 was felt by millions of people from Washington, D.C., to north of Boston. It even caused a full ground stop at Newark Airport.
The quake, occurring just 5 km beneath the Earth’s surface, was considered shallow, which is what contributed to more intense shaking at the surface.
According to the USGS, rocks in the eastern U.S. are significantly older, denser, and harder than those on the western side, compressed by time. This makes them more efficient conduits for seismic energy. Additionally, buildings in the Northeast tend to be older and may not adhere to the latest earthquake codes.
Despite disrupting work and school life, the earthquake was considered minor, according to the Michigan Technological University magnitude scale:
| Magnitude | Earthquake Effects | Estimated Number Each Year |
|---|---|---|
| 2.5 or less | Usually not felt, but can be recorded by seismograph. | Millions |
| 2.5 to 5.4 | Often felt, but only causes minor damage. | 500,000 |
| 5.5 to 6.0 | Slight damage to buildings and other structures. | 350 |
| 6.1 to 6.9 | May cause a lot of damage in very populated areas. | 100 |
| 7.0 to 7.9 | Major earthquake. Serious damage. | 10-15 |
| 8.0 or greater | Great earthquake. Can totally destroy communities near the epicenter. | One every year or two |
The largest earthquake felt in the area over the past 50 years was a 5.3 magnitude quake that occurred in Au Sable Forks, New York, in 2002. It damaged houses and cracked roads in a remote corner of the Adirondack Mountains, but caused no injuries.
| Date | Magnitude | Location | State |
|---|---|---|---|
| April 20, 2002 | 5.3 | Au Sable Forks | New York |
| October 7, 1983 | 5.1 | Newcomb | New York |
| April 5, 2024 | 4.8 | Whitehouse Station | New Jersey |
| October 16, 2012 | 4.7 | Hollis Center | Maine |
| January 16, 1994 | 4.6 | Sinking Spring | Pennsylvania |
| January 19, 1982 | 4.5 | Sanbornton | New Hampshire |
| September 25, 1998 | 4.5 | Adamsville | Pennsylvania |
| June 9, 1975 | 4.2 | Altona | New York |
| May 29, 1983 | 4.2 | Peru | Maine |
| April 23, 1984 | 4.2 | Conestoga | Pennsylvania |
| January 16, 1994 | 4.2 | Sinking Spring | Pennsylvania |
| November 3, 1975 | 4 | Long Lake | New York |
| June 17, 1991 | 4 | Worcester | New York |
The largest earthquake in U.S. history, however, was the 1964 Good Friday quake in Alaska, measuring 9.2 magnitude and killing 131 people.

-

 Business2 weeks ago
America’s Top Companies by Revenue (1994 vs. 2023)
-

 Environment2 weeks ago
Ranked: Top Countries by Total Forest Loss Since 2001
-

 Markets2 weeks ago
Visualizing America’s Shortage of Affordable Homes
-

 Maps2 weeks ago
Mapped: Average Wages Across Europe
-

 Mining2 weeks ago
Charted: The Value Gap Between the Gold Price and Gold Miners
-

 Demographics2 weeks ago
Visualizing the Size of the Global Senior Population
-

 Misc2 weeks ago
Tesla Is Once Again the World’s Best-Selling EV Company
-

 Technology2 weeks ago
Ranked: The Most Popular Smartphone Brands in the U.S.