Green
IMO 2020: The Big Shipping Shake-Up

IMO 2020: The Big Shipping Shake-Up
Over 90% of all global trade takes place on our oceans.
Unfortunately, the network of 59,000 vessels powering international commerce runs on sulfur-laden bunker fuel, and resulting emissions are causing problems on dry land.
As today’s infographic by Breakwave Advisors demonstrates, new emissions regulations taking effect in 2020 will have a big impact on the world’s massive fleet of marine shipping vessels.
The Regulatory Impact
The International Maritime Organization (IMO) – the UN agency responsible for ensuring a clean, safe, and efficient global shipping industry – will be implementing new regulations that will have massive impact on maritime shipping.
The regulations, dubbed IMO 2020, will enforce a 0.5% sulfur emissions cap worldwide starting January 1, 2020 ─ a dramatic decrease from the current emissions cap of 3.5%.
Here are a few ways marine fuel will likely be affected by these regulations:
- High-sulfur fuel oil will drop in price as the demand drops dramatically after January 1, 2020
- Diesel, a low-sulfur fuel oil, will be in higher demand and should see a price increase
- Refiners should also expect higher profits as refining runs increase to satisfy the new regulations
The Economic Impact
IMO 2020 will be one of the most dramatic fuel regulation changes ever implemented, with a significant impact on the global economy.
New regulations are certain to influence freight rates ─ the fees charged for delivering cargo from place to place. These rates can fluctuate depending on:
- Time and distance between ports
- Weight and density of the cargo
- Freight classification
- Mode of transport
- Tariffs and taxes
- Fuel costs
Rising fuel costs means rising freight rates, with much of these costs being passed to consumers.
In a full compliance scenario, we estimate the total impact to consumer wallets in 2020 could be around US$240 billion.
─ Goldman Sachs
The Environmental Impact
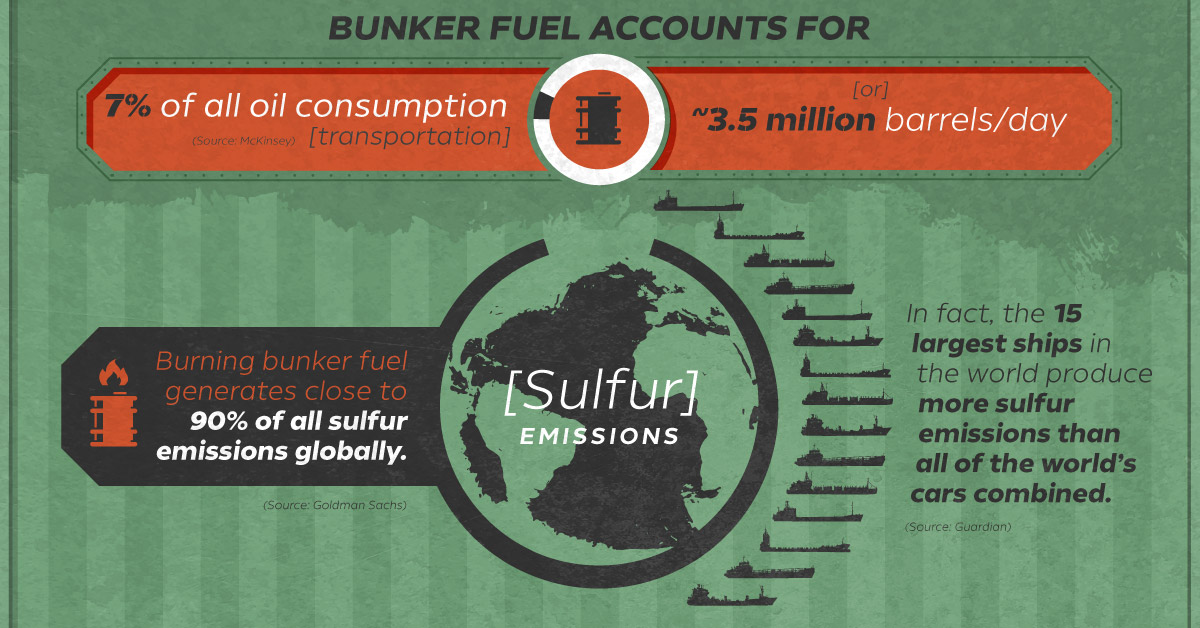
Not surprisingly, the world’s 59,000 transport ships, oil tankers, and cargo ships have a consequential impact on the environment.
Bunker fuel accounts for 7% of transportation oil consumption (~3.5 million barrels/day). Burning this fuel generates about 90% of all sulfur oxide and dioxide (SOx and SO2) emissions globally. In fact, the world’s 15 largest ships produce more SOx and SO2 emissions than every car combined.
These sulfur emissions can cause several harmful side effects on land ─ acid rain, smog, crop failures, and many respiratory illnesses such as lung cancer and asthma.
Changing Currents in the Shipping Sector
As IMO 2020’s implementation date nears, shippers have a few courses of action to become compliant and manage costs.
1) Switch to low-sulfur fuel
Bunker fuel use in the shipping industry was 3.5 million barrels per day in 2018, representing roughly 5% of global fuel demand.
Annual bunker fuel costs are predicted to rise by US$60 billion in 2020, a nearly 25% increase from 2019. Price increases this significant will directly impact freight rates ─ with no guarantee that fuel will always be available.
2) Slower Travel, Less Capacity
The costs of refining low-sulfur fuel will increase fuel prices. To offset this, shippers often travel at slower speeds.
For example, large ships might burn 280-300 metric tons of high-sulfur fuel oil (HSFO) a day at high speeds, but only 80-90 metric tons a day at slower speeds. Slower travel may cut costs and help reduce emissions, but it also decreases the capacity these vessels can transport due to longer travel times, which shrinks overall profit margins.
3) Refueling Detours
Adequate fuel supply will be a primary concern for shippers once IMO 2020 takes effect. Fuel shortages would cause inefficiencies and increase freight rates even more, as ships would be forced to detour to refuel more often.
4) Installing Scrubbers
A loophole of IMO 2020 is that emissions are regulated, not the actual sulfur content of fuel itself.
Rather than burning more expensive fuel, many shippers may decide to “capture” sulfur before it enters the environment by using scrubbers, devices that transfer sulfur emissions from exhaust to a disposal unit and discharges the emissions.
With IMO 2020 looming, only 1% of the global shipping fleet has been retrofitted with scrubbers. Forecasts for scrubber installations by mid-2020 run close to 5% of the current ships on the water.
There are a few reasons for such low numbers of installations. First, scrubbers are still somewhat unproven in maritime applications, so shippers are taking a “wait and see” approach. As well, even if a ship does qualify for a retrofit, cost savings won’t take effect until several years after installation. On the plus side, ships with scrubbers installed will still be able to use the existing, widely-available supply of bunker fuel.
Moving Forward
No matter which route shippers choose to take, the short-term impact is almost certainly going to mean higher freight rates for the marine shipping industry.
Green
How Carbon Credits Can Help Close the Climate Funding Gap
To keep a 1.5℃ world within reach, global emissions need to fall by as much as 45% by 2030, and carbon credits could help close the gap.


How Carbon Credits Can Help Close the Climate Funding Gap
Governments around the world have committed to the goals of the Paris Agreement, but their climate pledges are insufficient. To keep a 1.5℃ world within reach, global emissions need to fall by as much as 45% by 2030.
Bold and immediate action is essential, but so are resources that will make it happen.
In this graphic, we have partnered with Carbon Streaming to look at the role that the voluntary carbon market and carbon credits can play in closing that gap.
More Funds are Needed for Climate Finance
According to data from the Climate Policy Initiative, climate finance, which includes funds for both adaptation and mitigation, needs to increase at least five-fold, from $1.3T in 2021/2022, to an average $8.6T annually until 2030, and then to just over $10T in the two decades leading up to 2050.
That adds up to a very large number, but consider that in 2022, $7.0T went to fossil fuel subsidies, which almost covers the annual estimated outlay. And the world has shown that when pressed, governments can come up with the money, if the global pandemic is any indication.
Mobilizing Carbon Finance to the Developing World
But the same cannot be said of the developing world, where debt, inequality, and poverty reduce the ability of governments to act. And this is where carbon credits can play an important role. According to analyses from Ecosystem Marketplace, carbon credits help move capital from developed countries, to where funds are needed in the developing world.
For example, in 2019, 69.2% of the carbon credits by volume in the voluntary carbon market were purchased by buyers in Europe, and nearly a third from North America. Compare that to over 90% of the volume of carbon credits sold in the voluntary carbon market in 2022 came from projects that were located outside of those two regions.
Carbon Credits Can Complement Decarbonization Efforts
Carbon credits can also complement decarbonization efforts in the corporate world, where more and more companies have been signing up to reduce emissions. According to the 2022 monitoring report from the Science Based Targets initiative, 4,230 companies around the world had approved targets and commitments, which represented an 88% increase from the prior year. However, as of year end 2022, combined scope 1 and 2 emissions covered by science-based targets totaled approximately 2 GtCO2e, which represents just a fraction of global emissions.
The fine print is that this is just scope 1 and 2 emissions, and doesn’t include scope 3 emissions, which can account for more than 70% of a company’s total emissions. And as these emissions come under greater and greater scrutiny the closer we get to 2030 and beyond, the voluntary carbon credit market could expand exponentially to help meet the need to compensate for these emissions.
Potential Carbon Credit Market Size in 2030
OK, but how big? In 2022, the voluntary carbon credit market was around $2B, but some analysts predict that it could grow to between $5–250 billion by 2030.
| Firm | Low Estimate | High Estimate |
|---|---|---|
| Bain & Company | $15B | $30B |
| Barclays | N/A | $250B |
| Citigroup | $5B | $50B |
| McKinsey & Company | $5B | $50B |
| Morgan Stanley | N/A | $100B |
| Shell / Boston Consulting Group | $10B | $40B |
Morgan Stanley and Barclays were the most bullish on the size of the voluntary carbon credit market in 2030, but the latter firm was even more optimistic about 2050, and predicted that the voluntary carbon credit market could grow to a colossal $1.5 trillion.
Carbon Streaming is Focused on Carbon Credit Integrity
Ultimately, carbon credits could have an important role to play in marshaling the resources needed to keep the world on track to net zero by 2050, and avoiding the worst consequences of a warming world.
Carbon Streaming uses streaming transactions, a proven and flexible funding model, to scale high-integrity carbon credit projects to advance global climate action and UN Sustainable Development Goals.
Learn more at www.carbonstreaming.com.

-

 Green1 week ago
Ranking the Top 15 Countries by Carbon Tax Revenue
This graphic highlights France and Canada as the global leaders when it comes to generating carbon tax revenue.
-

 Green1 week ago
Ranked: The Countries With the Most Air Pollution in 2023
South Asian nations are the global hotspot for pollution. In this graphic, we rank the world’s most polluted countries according to IQAir.
-

 Environment2 weeks ago
Top Countries By Forest Growth Since 2001
One country is taking reforestation very seriously, registering more than 400,000 square km of forest growth in two decades.
-

 Green3 weeks ago
Ranked: Top Countries by Total Forest Loss Since 2001
The country with the most forest loss since 2001 lost as much forest cover as the next four countries combined.
-

 Markets2 months ago
The World’s Top Cocoa Producing Countries
Here are the largest cocoa producing countries globally—from Côte d’Ivoire to Brazil—as cocoa prices hit record highs.
-

 Environment2 months ago
Charted: Share of World Forests by Country
We visualize which countries have the biggest share of world forests by area—and while country size plays a factor, so too, does the environment.


-
Green1 week ago
Ranked: The Countries With the Most Air Pollution in 2023
-

 Automotive2 weeks ago
Almost Every EV Stock is Down After Q1 2024
-

 AI2 weeks ago
The Stock Performance of U.S. Chipmakers So Far in 2024
-

 Markets2 weeks ago
Charted: Big Four Market Share by S&P 500 Audits
-

 Real Estate2 weeks ago
Ranked: The Most Valuable Housing Markets in America
-

 Money2 weeks ago
Which States Have the Highest Minimum Wage in America?
-

 AI2 weeks ago
Ranked: Semiconductor Companies by Industry Revenue Share
-

 Travel2 weeks ago
Ranked: The World’s Top Flight Routes, by Revenue