Misc
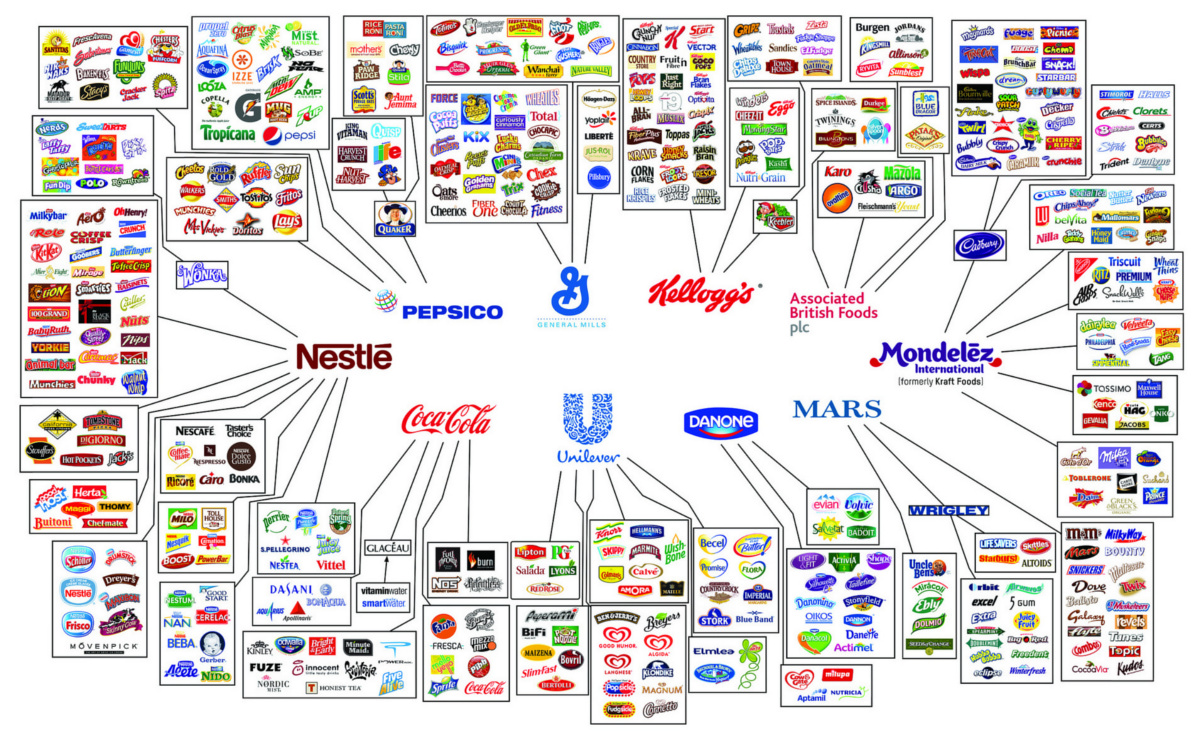
The Illusion of Choice in Consumer Brands
The Illusion of Choice in Consumer Brands
Explore the full-size version of the above graphic in all its glory.
If today’s infographic looks familiar, that’s because it originates from a well-circulated report that Oxfam International puts together to show consolidation in the mass consumer goods industry.
We are sharing it because we believe it is important for you to be aware of who is supplying the different brands and goods served on your dinner table.
Unlikely Links
The illusion of choice does not arise from the products we expect the companies to sell. We inherently know that PepsiCo sells plenty of beverages, including its flagship product. We know that Nestlé makes Kit Kat, Nesquick chocolate syrup, Nespresso coffee machines, and Nescafé instant coffee.
What is less obvious is that Nestlé makes Gerber baby food, Hot Pockets, DiGiorno pizzas, and Stouffer brand frozen foods. Nestlé even owns two competing brands of fancy, carbonated water: San Pellegrino and Perrier.
In fact, Nestlé has at least 29 brands with annual sales over $1 billion. The company literally has hundreds of different products in sectors ranging from pet food to soups and sauces. It’s the world’s largest food company by revenues, and it’s worth a whopping $240 billion in market capitalization.
They Might Be Giants
It’s not just Nestlé that is mind-boggling in size and scope.
Other companies such as Coca-Cola, Kellogg’s, Mondelēz, PepsiCo, General Mills, Danone, and Mars are also massive. They each own dozens of brands that dominate certain product categories.
Want to buy crackers? Pick up some Ritz, Triscuits, Wheat Thins, Air Crisps, or Premium brand crackers – but know they are all owned by Mondelēz (formerly Kraft Foods).
Buying a chocolate bar? There are seemingly hundreds to choose from, but its just the illusion of choice. They pretty much all come from Mars, Nestlé, or Mondelēz (which owns Cadbury).
There’s nothing wrong in buying from these brands, but remember that each dollar of your money is a vote. Vote for products and companies you believe in!
Note: the above graphic is about 1.5 years old, and it misses recent acquisitions or changes in brand ownership. For example, Power Bar is now owned by Post Holdings, another giant consumer foods conglomerate. That said, we believes the point of the graphic still comes across.


Maps
The Largest Earthquakes in the New York Area (1970-2024)
The earthquake that shook buildings across New York in April 2024 was the third-largest quake in the Northeast U.S. over the past 50 years.


The Largest Earthquakes in the New York Area
This was originally posted on our Voronoi app. Download the app for free on Apple or Android and discover incredible data-driven charts from a variety of trusted sources.
The 4.8 magnitude earthquake that shook buildings across New York on Friday, April 5th, 2024 was the third-largest quake in the U.S. Northeast area over the past 50 years.
In this map, we illustrate earthquakes with a magnitude of 4.0 or greater recorded in the Northeastern U.S. since 1970, according to the United States Geological Survey (USGS).
Shallow Quakes and Older Buildings
The earthquake that struck the U.S. Northeast in April 2024 was felt by millions of people from Washington, D.C., to north of Boston. It even caused a full ground stop at Newark Airport.
The quake, occurring just 5 km beneath the Earth’s surface, was considered shallow, which is what contributed to more intense shaking at the surface.
According to the USGS, rocks in the eastern U.S. are significantly older, denser, and harder than those on the western side, compressed by time. This makes them more efficient conduits for seismic energy. Additionally, buildings in the Northeast tend to be older and may not adhere to the latest earthquake codes.
Despite disrupting work and school life, the earthquake was considered minor, according to the Michigan Technological University magnitude scale:
| Magnitude | Earthquake Effects | Estimated Number Each Year |
|---|---|---|
| 2.5 or less | Usually not felt, but can be recorded by seismograph. | Millions |
| 2.5 to 5.4 | Often felt, but only causes minor damage. | 500,000 |
| 5.5 to 6.0 | Slight damage to buildings and other structures. | 350 |
| 6.1 to 6.9 | May cause a lot of damage in very populated areas. | 100 |
| 7.0 to 7.9 | Major earthquake. Serious damage. | 10-15 |
| 8.0 or greater | Great earthquake. Can totally destroy communities near the epicenter. | One every year or two |
The largest earthquake felt in the area over the past 50 years was a 5.3 magnitude quake that occurred in Au Sable Forks, New York, in 2002. It damaged houses and cracked roads in a remote corner of the Adirondack Mountains, but caused no injuries.
| Date | Magnitude | Location | State |
|---|---|---|---|
| April 20, 2002 | 5.3 | Au Sable Forks | New York |
| October 7, 1983 | 5.1 | Newcomb | New York |
| April 5, 2024 | 4.8 | Whitehouse Station | New Jersey |
| October 16, 2012 | 4.7 | Hollis Center | Maine |
| January 16, 1994 | 4.6 | Sinking Spring | Pennsylvania |
| January 19, 1982 | 4.5 | Sanbornton | New Hampshire |
| September 25, 1998 | 4.5 | Adamsville | Pennsylvania |
| June 9, 1975 | 4.2 | Altona | New York |
| May 29, 1983 | 4.2 | Peru | Maine |
| April 23, 1984 | 4.2 | Conestoga | Pennsylvania |
| January 16, 1994 | 4.2 | Sinking Spring | Pennsylvania |
| November 3, 1975 | 4 | Long Lake | New York |
| June 17, 1991 | 4 | Worcester | New York |
The largest earthquake in U.S. history, however, was the 1964 Good Friday quake in Alaska, measuring 9.2 magnitude and killing 131 people.

-
 Money2 weeks ago
Visualizing the Growth of $100, by Asset Class (1970-2023)
-

 Money1 week ago
Where Does One U.S. Tax Dollar Go?
-

 Green2 weeks ago
Ranked: Top Countries by Total Forest Loss Since 2001
-

 Real Estate2 weeks ago
Visualizing America’s Shortage of Affordable Homes
-

 Maps2 weeks ago
Mapped: Average Wages Across Europe
-

 Mining2 weeks ago
Charted: The Value Gap Between the Gold Price and Gold Miners
-

 Demographics2 weeks ago
Visualizing the Size of the Global Senior Population
-

 Automotive2 weeks ago
Tesla Is Once Again the World’s Best-Selling EV Company