Green
Visualizing the Human Impact on the Earth’s Surface
Click here to view the full version of this graphic
Visualizing the Human Impact on the Earth’s Surface
View the high resolution version of this map by clicking here.
There is little doubt that human activity has impacted the Earth, but to what extent?
As it turns out, nearly 95% of the Earth’s surface shows some form of human modification, with 85% bearing evidence of multiple forms of human impact.
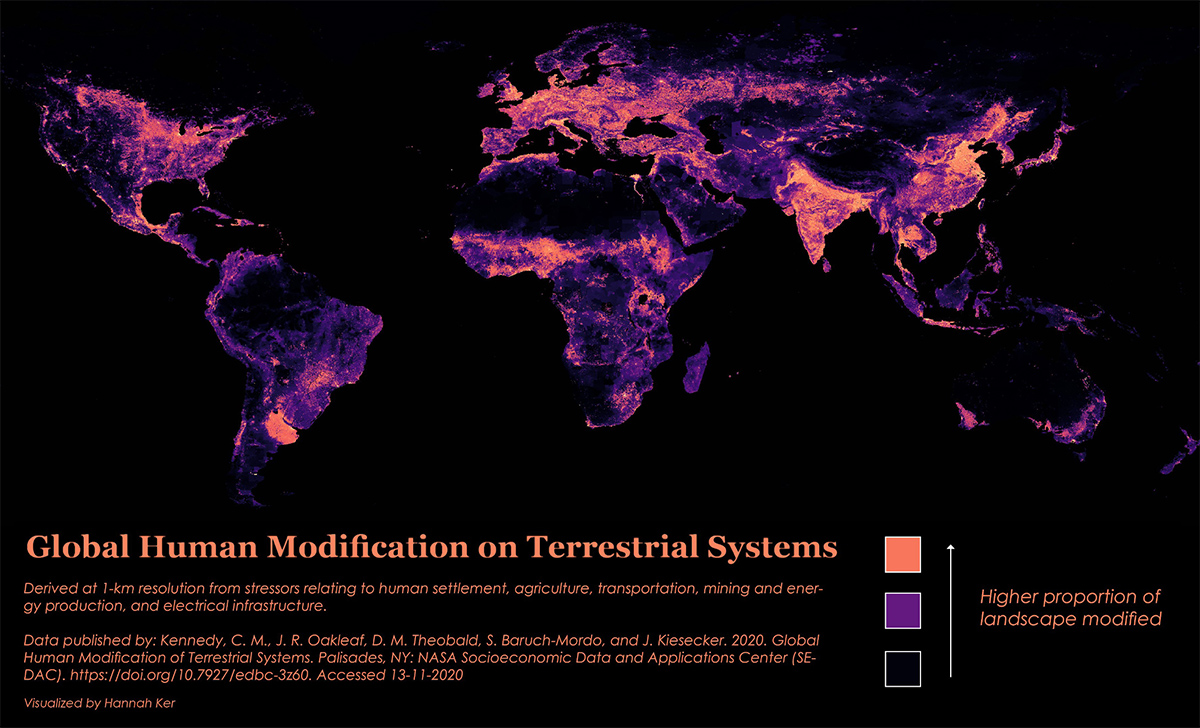
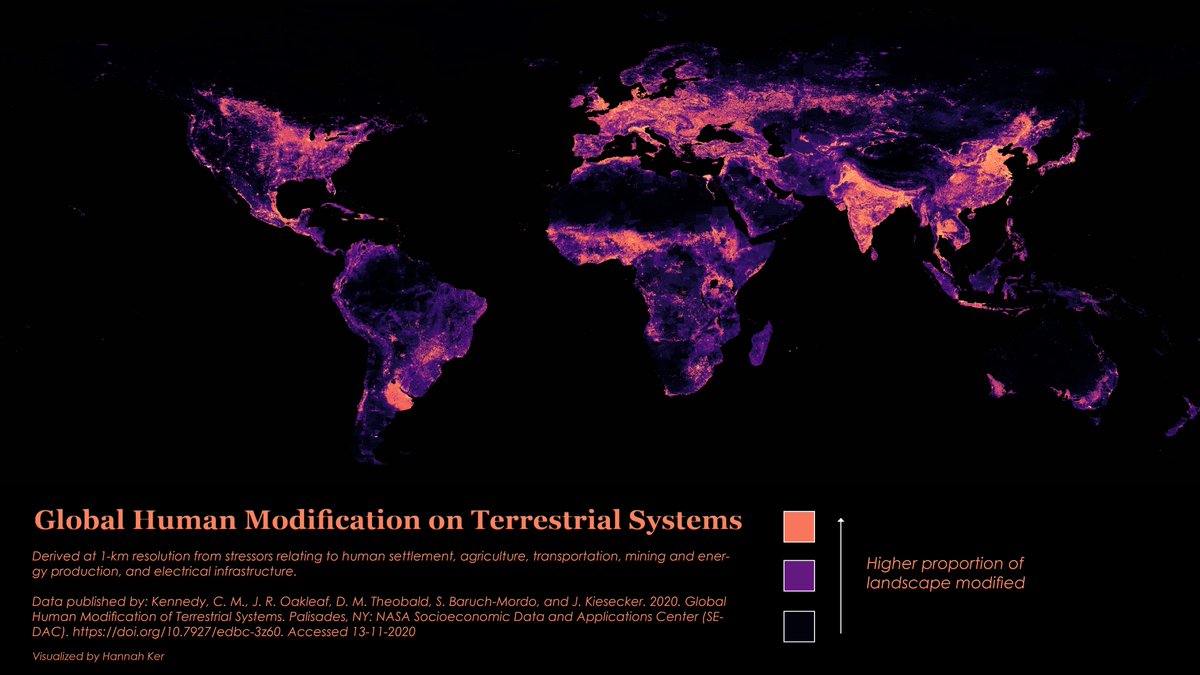
This map by data scientist Hannah Ker outlines the extent of humanity’s modification on terrestrial land ecosystems.
Measuring the Human Impact
This map relies on the Global Human Modification of Terrestrial Systems data set, which tracks the physical extent of 13 anthropogenic stressors across five categories.
- Human settlement: population density, built‐up areas
- Agriculture: cropland, livestock
- Transportation: major roads, minor roads, two tracks, railroads
- Mining and energy production: mining, oil wells, wind turbines
- Electrical infrastructure: powerlines, nighttime lights
Researchers compiled all these stress factors and scaled their impact from 0 to 1. Then, in order to map the impacts spatially, the surface of land was organized into cells of 1 kilometer in length creating “edges” of varying impact.
These impacts are further organized by biomes—distinct biological communities that have formed in response to a shared physical climate.
Digging into the Data
Only 5% of the world’s lands are unaffected by humans, which amounts to nearly 7 million km² of the Earth’s land, and 44% (59 million km²) is categorized as low modification.
The remainder of land has a moderate to high degree of modification: with 34% categorized as moderate (46 million km²), 13% categorized as high (17 million km²), and 4% categorized as very high modification (5.5 million km²). This latter category is the most visible on the map, with portions of China, India, and Italy serving as focal points.
Below is a look at how Earth’s various biomes fare under this ranking system:
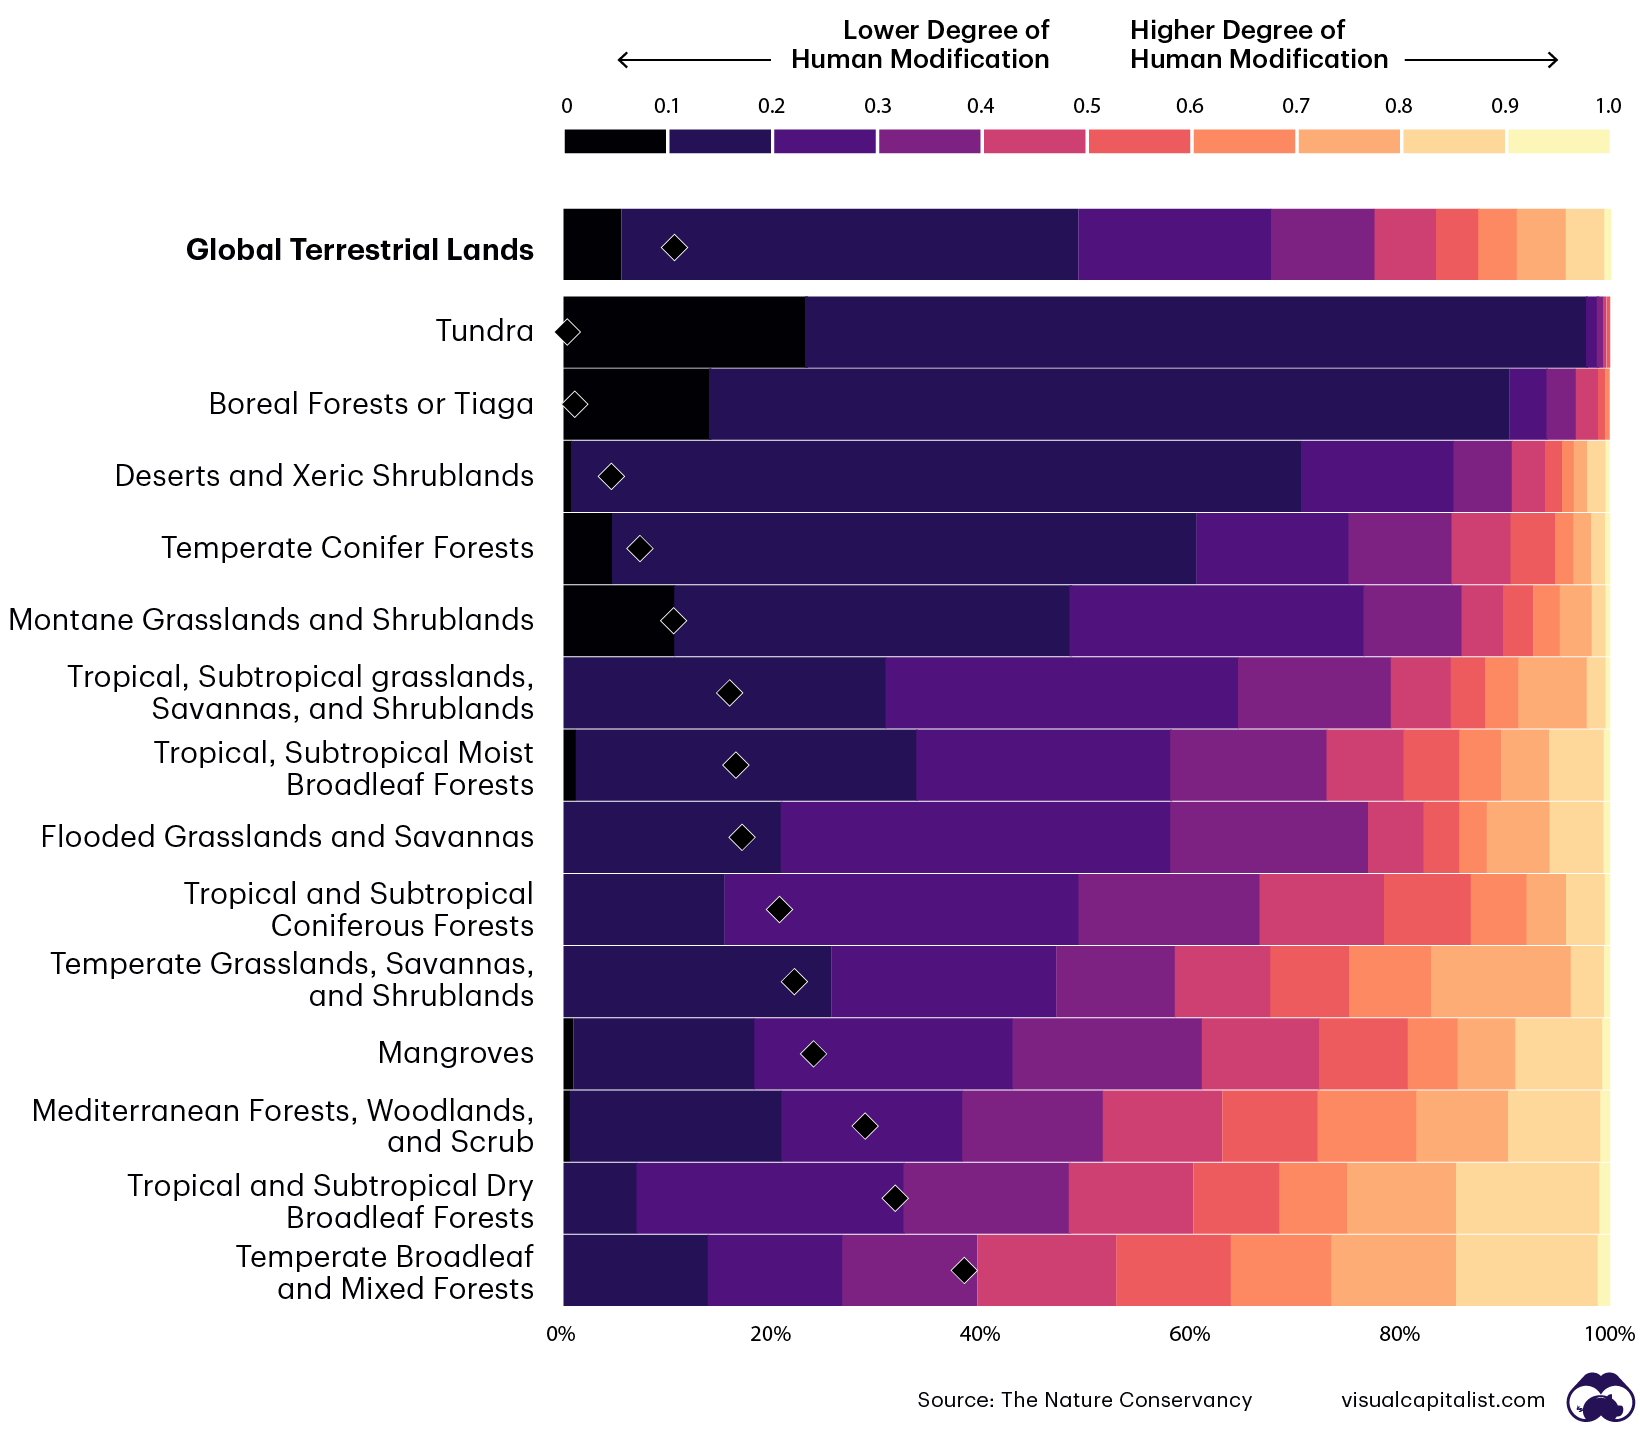
Out of the 14 biomes studied, the least modified biomes are tundra, boreal forests, deserts, temperate coniferous forests, and montane grasslands. Tropical dry broadleaf forests, temperate broadleaf forests, Mediterranean forests, mangroves, and temperate grasslands are the most modified biomes.
Dense human settlements, agricultural land uses, networks of infrastructure, and industrial activities dominate the more highly modified biomes. These lands are commonly subject to five or more human stressors simultaneously, threatening naturally-occurring ecosystem services.
What are Ecosystem Services?
An ecosystem service is any positive benefit that wildlife or ecosystems provide to people, and they can be sorted into four categories:
- Provisioning Services: This is the primary benefit of nature. Humans derive their food, water, and resources from nature.
- Regulating: Plants clean air and filter water, tree roots help to keep soil in place to prevent erosion, bees pollinate flowers, and bacterial colonies help to decompose waste.
- Cultural Services: Humans have long interacted with the “wild” and it in turn has influenced our social, intellectual, and cultural development. However, the built environment of a city or town separates man from nature and ancient patterns of life. Ecosystems have long served as inspiration for music, art, architecture, and recreation.
- Supporting Services: Ecosystems contain the fundamental natural processes that make life possible such as photosynthesis, nutrient cycling, soil creation, and the water cycle. These natural processes bring the Earth to life. Without these supporting services, provisional, regulating, and cultural services wouldn’t exist.
A Delicate Balance
With each encroachment upon habitat, the potential increases for humans to inadvertently upset the careful balance of ecosystem services that have nourished the processes of life on Earth.
As we become more aware of the human impact on the plant, we can make smarter decisions about how our society and economies function—ultimately ensuring that the same ecosystem services are there for future generations.


Green
Ranking the Top 15 Countries by Carbon Tax Revenue
This graphic highlights France and Canada as the global leaders when it comes to generating carbon tax revenue.


Top 15 Countries by Carbon Tax Revenue
This was originally posted on our Voronoi app. Download the app for free on iOS or Android and discover incredible data-driven charts from a variety of trusted sources.
Carbon taxes are designed to discourage CO2 emissions by increasing the cost of carbon-intensive activities and incentivizing the adoption of cleaner energy alternatives.
In this graphic we list the top 15 countries by carbon tax revenue as of 2022. The data is from the World Bank’s State and Trends of Carbon Pricing Report, published in April 2023.
France and Canada Lead in Global Carbon Tax Revenue
In 2022, the top 15 countries generated approximately $30 billion in revenue from carbon taxes.
France and Canada lead in this regard, accounting for over half of the total amount. Both countries have implemented comprehensive carbon pricing systems that cover a wide range of sectors, including transportation and industry, and they have set relatively high carbon tax rates.
| Country | Government revenue in 2022 ($ billions) |
|---|---|
| 🇫🇷 France | $8.9 |
| 🇨🇦 Canada | $7.8 |
| 🇸🇪 Sweden | $2.3 |
| 🇳🇴 Norway | $2.1 |
| 🇯🇵 Japan | $1.8 |
| 🇫🇮 Finland | $1.7 |
| 🇨🇭 Switzerland | $1.6 |
| 🇬🇧 United Kingdom | $0.9 |
| 🇮🇪 Ireland | $0.7 |
| 🇩🇰 Denmark | $0.5 |
| 🇵🇹 Portugal | $0.5 |
| 🇦🇷 Argentina | $0.3 |
| 🇲🇽 Mexico | $0.2 |
| 🇸🇬 Singapore | $0.1 |
| 🇿🇦 South Africa | $0.1 |
In Canada, the total carbon tax revenue includes both national and provincial taxes.
While carbon pricing has been recognized internationally as one of the more efficient mechanisms for reducing CO2 emissions, research is divided over what the global average carbon price should be to achieve the goals of the Paris Climate Agreement, which aims to limit global warming to 1.5–2°C by 2100 relative to pre-industrial levels.
A recent study has shown that carbon pricing must be supported by other policy measures and innovations. According to a report from Queen’s University, there is no feasible carbon pricing scenario that is high enough to limit emissions sufficiently to achieve anything below 2.4°C warming on its own.

-

 Real Estate2 weeks ago
Visualizing America’s Shortage of Affordable Homes
-

 Technology1 week ago
Ranked: Semiconductor Companies by Industry Revenue Share
-

 Money2 weeks ago
Which States Have the Highest Minimum Wage in America?
-

 Real Estate2 weeks ago
Ranked: The Most Valuable Housing Markets in America
-

 Business2 weeks ago
Charted: Big Four Market Share by S&P 500 Audits
-

 AI2 weeks ago
The Stock Performance of U.S. Chipmakers So Far in 2024
-

 Misc2 weeks ago
Almost Every EV Stock is Down After Q1 2024
-

 Money2 weeks ago
Where Does One U.S. Tax Dollar Go?