Demographics
Interactive: How the U.S. Population Has Changed in 10 Years, by State
var divElement = document.getElementById(‘viz1624579073838’); var vizElement = divElement.getElementsByTagName(‘object’)[0]; vizElement.style.width=’1200px’;vizElement.style.height=’1527px’; var scriptElement = document.createElement(‘script’); scriptElement.src = ‘https://public.tableau.com/javascripts/api/viz_v1.js’; vizElement.parentNode.insertBefore(scriptElement, vizElement);
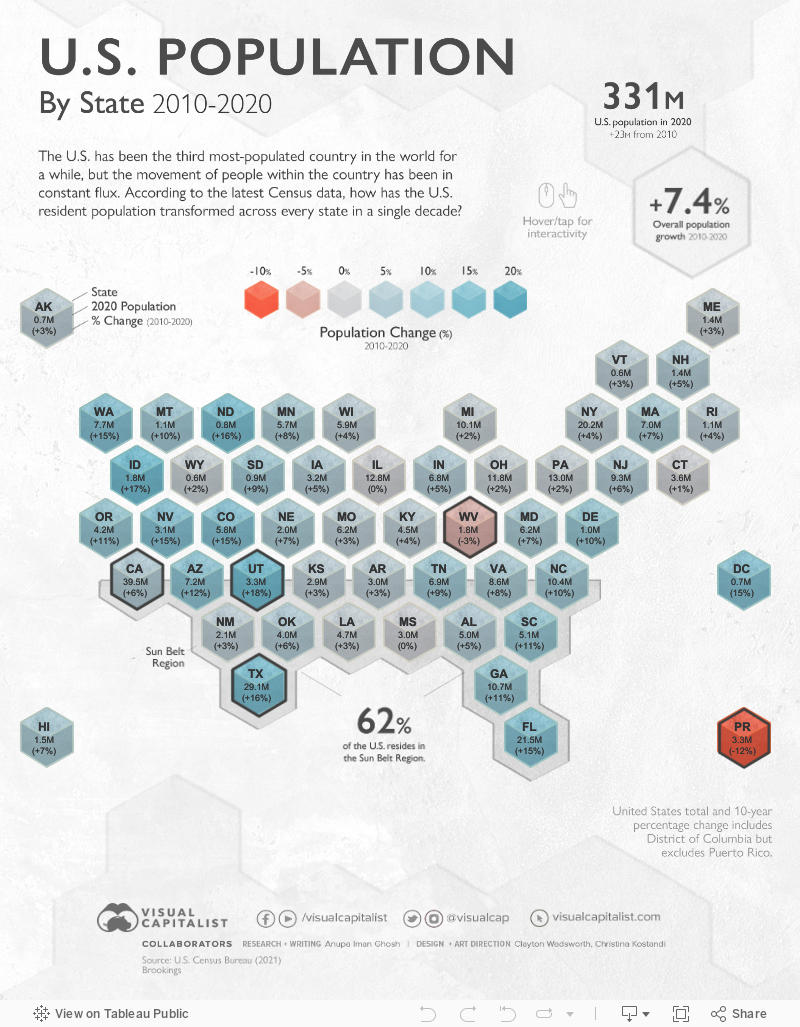


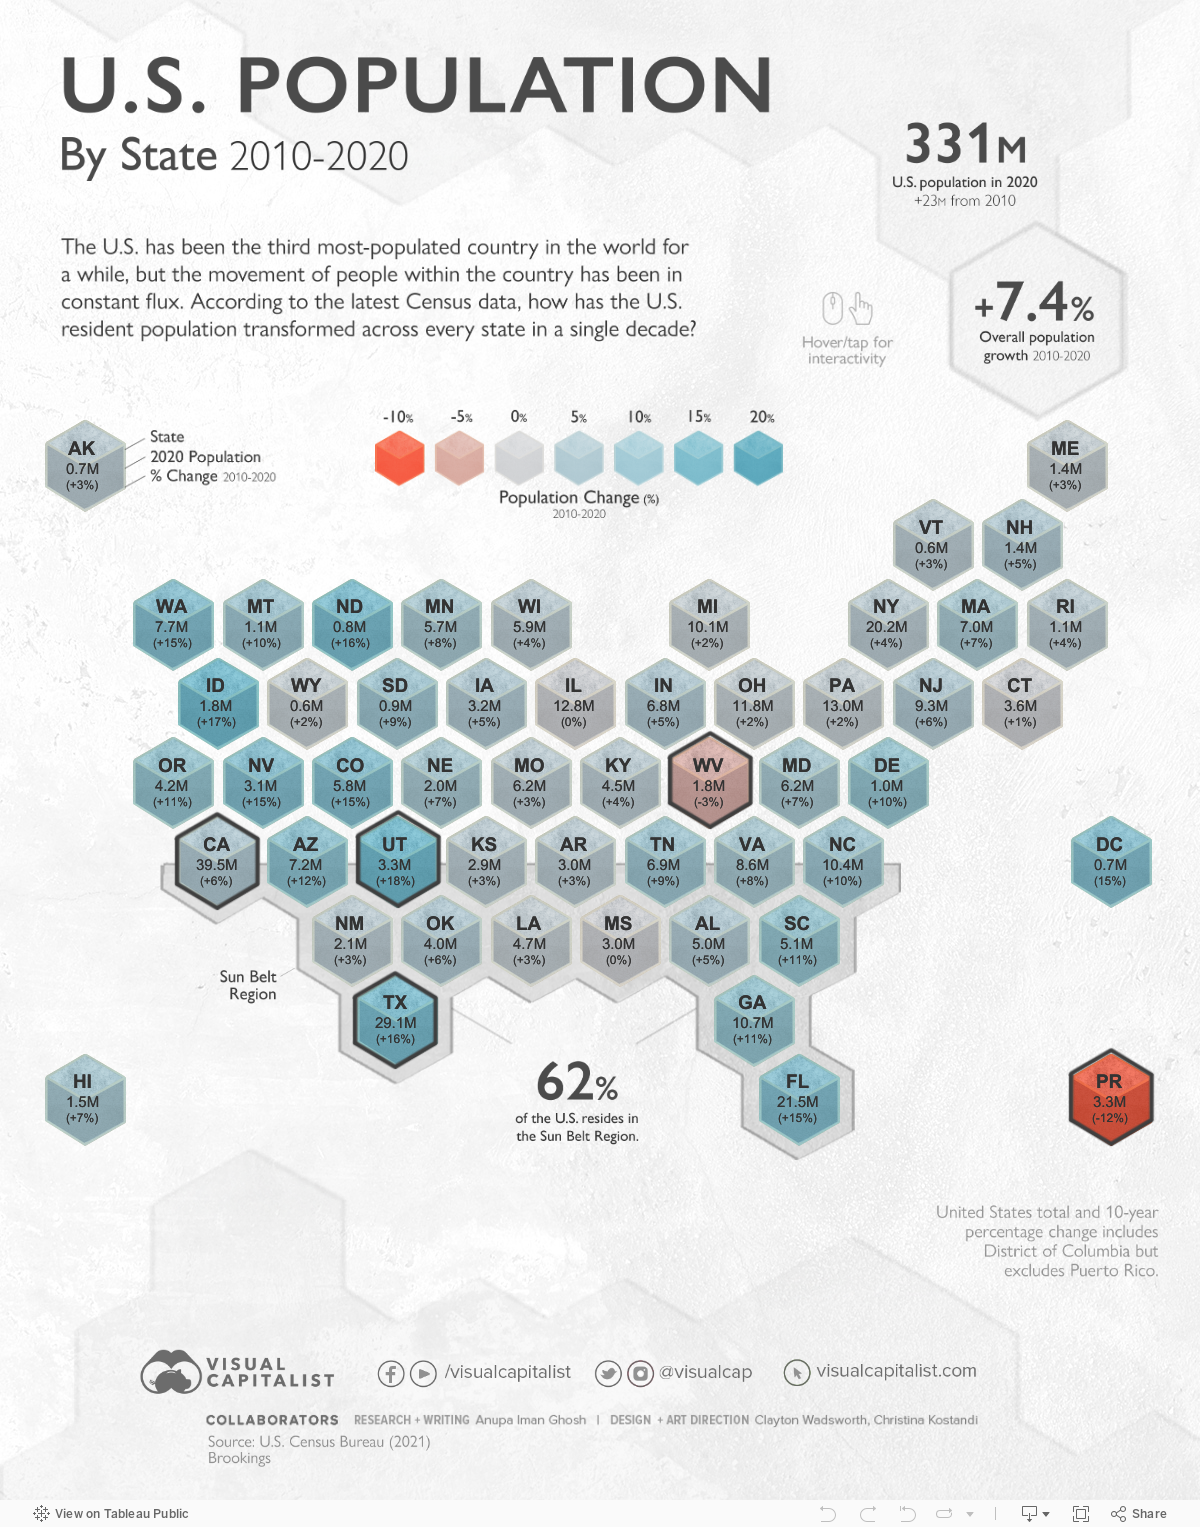
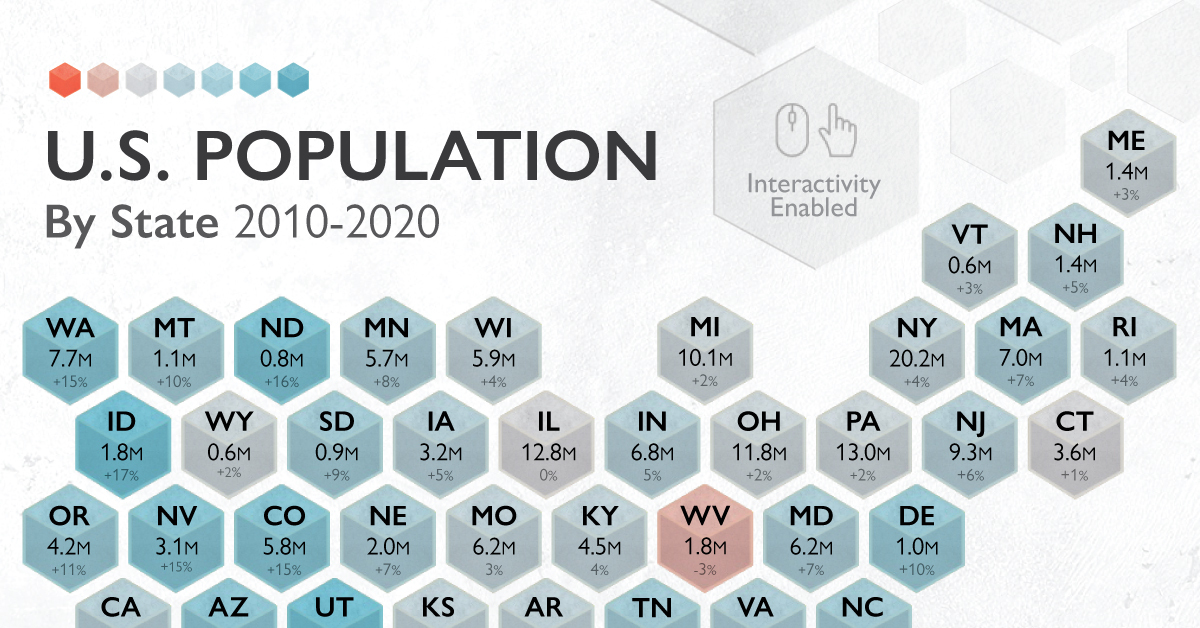
U.S. Population Change in the Last Decade, by State
The U.S. is the third most-populated country in the world, behind only two Asian giants of China and India respectively. But within the country, a lot can change in 10 years, and populations are especially mutable in nature.
As people moved in and out of certain areas for both lifestyle and economic reasons, which U.S. state populations fluctuated the most?
Drawing from the latest Census Bureau data, we look at how each state’s resident populations evolved over the past decade. But first, a blast from the past.
Historical Trends: U.S. Population Since the 1930s
Population growth trends in the U.S. have been closely tied to the economic ebbs and flows experienced by the nation. In one stark example, the country’s 10-year population growth rate plummeted to just 7.3% due to the Great Depression.
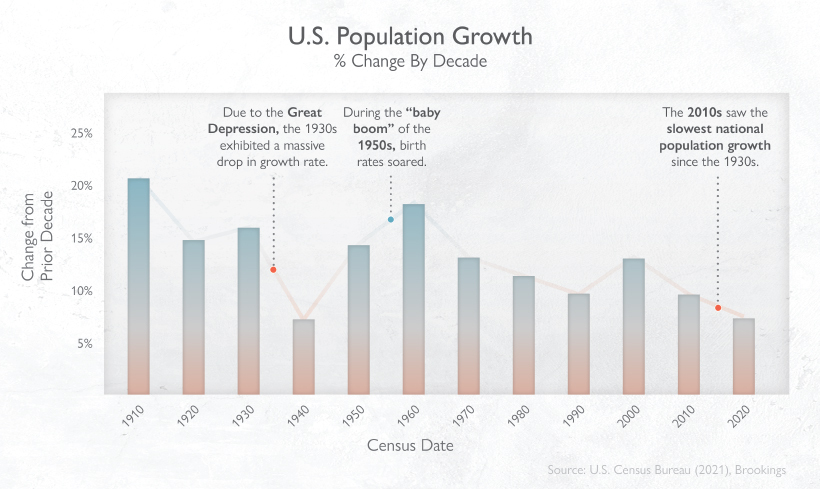
This was later offset by the post-WWII “Baby Boom”, during which birth rates soared once more, bumping up the population 10-year growth rate to 18.5% in the 1950s. The Baby Boomer generation now wields the most influence over the U.S. economy and society thanks to the favorable economic conditions in which they were born.
However, U.S. population growth rates recently hit new lows—the slower pace in the 2010s is rivalling that of the 1930s. According to Brookings, there area few factors at play:
- Falling fertility rate
- An increase in deaths (aging population, overdose deaths)
- Lower immigration rate
With all this in mind, how does the current landscape of the U.S. population by state look?
The Entire U.S. Population by State in 2020
The U.S. experienced 7.4% population growth between 2010-2020, which equates to the addition of 22.7 million people.
An impressive one-tenth of this growth occurred in California, and it remains the most populous state, rising above 39.5 million people in 2020. The SoCal megaregion—Los Angeles and San Diego—alone contributes more than $1.4 trillion to global economic output.
| Area | 2020 Census Resident Population | Numeric Change (2010-2020) | % Change (2010-2020) |
|---|---|---|---|
| Alabama | 5,024,279 | 244,543 | 5.1% |
| Alaska | 733,391 | 23,160 | 3.3% |
| Arizona | 7,151,502 | 759,485 | 11.9% |
| Arkansas | 3,011,524 | 95,606 | 3.3% |
| California | 39,538,223 | 2,284,267 | 6.1% |
| Colorado | 5,773,714 | 744,518 | 14.8% |
| Connecticut | 3,605,944 | 31,847 | 0.9% |
| Delaware | 989,948 | 92,014 | 10.2% |
| District of Columbia (Territory) | 689,545 | 87,822 | 14.6% |
| Florida | 21,538,187 | 2,736,877 | 14.6% |
| Georgia | 10,711,908 | 1,024,255 | 10.6% |
| Hawaii | 1,455,271 | 94,970 | 7.0% |
| Idaho | 1,839,106 | 271,524 | 17.3% |
| Illinois | 12,812,508 | -18,124 | -0.1% |
| Indiana | 6,785,528 | 301,726 | 4.7% |
| Iowa | 3,190,369 | 144,014 | 4.7% |
| Kansas | 2,937,880 | 84,762 | 3.0% |
| Kentucky | 4,505,836 | 166,469 | 3.8% |
| Louisiana | 4,657,757 | 124,385 | 2.7% |
| Maine | 1,362,359 | 33,998 | 2.6% |
| Maryland | 6,177,224 | 403,672 | 7.0% |
| Massachusetts | 7,029,917 | 482,288 | 7.4% |
| Michigan | 10,077,331 | 193,691 | 2.0% |
| Minnesota | 5,706,494 | 402,569 | 7.6% |
| Mississippi | 2,961,279 | -6,018 | -0.2% |
| Missouri | 6,154,913 | 165,986 | 2.8% |
| Montana | 1,084,225 | 94,810 | 9.6% |
| Nebraska | 1,961,504 | 135,163 | 7.4% |
| Nevada | 3,104,614 | 404,063 | 15.0% |
| New Hampshire | 1,377,529 | 61,059 | 4.6% |
| New Jersey | 9,288,994 | 497,100 | 5.7% |
| New Mexico | 2,117,522 | 58,343 | 2.8% |
| New York | 20,201,249 | 823,147 | 4.2% |
| North Carolina | 10,439,388 | 903,905 | 9.5% |
| North Dakota | 779,094 | 106,503 | 15.8% |
| Ohio | 11,799,448 | 262,944 | 2.3% |
| Oklahoma | 3,959,353 | 208,002 | 5.5% |
| Oregon | 4,237,256 | 406,182 | 10.6% |
| Pennsylvania | 13,002,700 | 300,321 | 2.4% |
| Puerto Rico (Territory) | 3,285,874 | -439,915 | -11.8% |
| Rhode Island | 1,097,379 | 44,812 | 4.3% |
| South Carolina | 5,118,425 | 493,061 | 10.7% |
| South Dakota | 886,667 | 72,487 | 8.9% |
| Tennessee | 6,910,840 | 564,735 | 8.9% |
| Texas | 29,145,505 | 3,999,944 | 15.9% |
| Utah | 3,271,616 | 507,731 | 18.4% |
| Vermont | 643,077 | 17,336 | 2.8% |
| Virginia | 8,631,393 | 630,369 | 7.9% |
| Washington | 7,705,281 | 980,741 | 14.6% |
| West Virginia | 1,793,716 | -59,278 | -3.2% |
| Wisconsin | 5,893,718 | 206,732 | 3.6% |
| Wyoming | 576,851 | 13,225 | 2.3% |
| U.S. Total | 331,449,281 | 22,703,743 | 7.4% |
*Note: U.S. total and 10-year percentage change includes District of Columbia but excludes Puerto Rico
Overall, there’s been a significant shift in population towards the Sun Belt region (stretching from Southeast to Southwest), where 62% of the U.S. now resides. Let’s take a closer look at the biggest gainers and decliners over time.
Gainers: Utah, Texas
Utah saw the quickest population growth rate of 18.4% in the last decade. Drawn in by strong economic prospects, net migration into the state is balancing out a decline in births. What’s interesting is that 80% of Utah’s population is concentrated in the Wasatch Front – a metro area anchored by Salt Lake City and the chain of cities and towns running north and south of Utah’s largest city.
A little further south, Texas swelled by almost 4 million residents in the last 10 years. Much of this growth took place in the “Texas Triangle”, which contains Dallas, Houston, San Antonio, and Austin. This booming region of the country contributes over $1.2 trillion to global economic output.
Decliners: West Virginia, Puerto Rico
West Virginia lost the most people in a decade, seeing a numeric population decline of 59,278. This may be explained by an aging population—16% of West Virginians are 65 years old and above.
When territories are also taken into account, Puerto Rico saw the biggest percentage decline of 11.8%, or close to 44,000 people over 10 years. Many of them moved into the mainland, and especially into Florida, after two hurricanes hit the island in 2017.
Full Speed Ahead: States Competing On Forward Momentum
By 2025, California will be home to five of the fastest-growing urban U.S. cities. The unstoppable growth of the tech industry in Silicon Valley is partly behind this, as many people flock to the West Coast to fill the shoes of highly skilled jobs required.
But could Silicon Valley one day lose its steam? Current and projected population growth in Texas is bolstering its tech potential too—in fact, it’s been dubbed the next “Silicon Hills”, with many tech companies from SpaceX to Oracle choosing to camp out in Austin instead.


Demographics
The Smallest Gender Wage Gaps in OECD Countries
Which OECD countries have the smallest gender wage gaps? We look at the 10 countries with gaps lower than the average.


The Smallest Gender Pay Gaps in OECD Countries
This was originally posted on our Voronoi app. Download the app for free on iOS or Android and discover incredible data-driven charts from a variety of trusted sources.
Among the 38 member countries in the Organization for Economic Cooperation and Development (OECD), several have made significant strides in addressing income inequality between men and women.
In this graphic we’ve ranked the OECD countries with the 10 smallest gender pay gaps, using the latest data from the OECD for 2022.
The gender pay gap is calculated as the difference between median full-time earnings for men and women divided by the median full-time earnings of men.
Which Countries Have the Smallest Gender Pay Gaps?
Luxembourg’s gender pay gap is the lowest among OECD members at only 0.4%—well below the OECD average of 11.6%.
| Rank | Country | Percentage Difference in Men's & Women's Full-time Earnings |
|---|---|---|
| 1 | 🇱🇺 Luxembourg | 0.4% |
| 2 | 🇧🇪 Belgium | 1.1% |
| 3 | 🇨🇷 Costa Rica | 1.4% |
| 4 | 🇨🇴 Colombia | 1.9% |
| 5 | 🇮🇪 Ireland | 2.0% |
| 6 | 🇭🇷 Croatia | 3.2% |
| 7 | 🇮🇹 Italy | 3.3% |
| 8 | 🇳🇴 Norway | 4.5% |
| 9 | 🇩🇰 Denmark | 5.8% |
| 10 | 🇵🇹 Portugal | 6.1% |
| OECD Average | 11.6% |
Notably, eight of the top 10 countries with the smallest gender pay gaps are located in Europe, as labor equality laws designed to target gender differences have begun to pay off.
The two other countries that made the list were Costa Rica (1.4%) and Colombia (1.9%), which came in third and fourth place, respectively.
How Did Luxembourg (Nearly) Eliminate its Gender Wage Gap?
Luxembourg’s virtually-non-existent gender wage gap in 2020 can be traced back to its diligent efforts to prioritize equal pay. Since 2016, firms that have not complied with the Labor Code’s equal pay laws have been subjected to penalizing fines ranging from €251 to €25,000.
Higher female education rates also contribute to the diminishing pay gap, with Luxembourg tied for first in the educational attainment rankings of the World Economic Forum’s Global Gender Gap Index Report for 2023.
See More Graphics about Demographics and Money
While these 10 countries are well below the OECD’s average gender pay gap of 11.6%, many OECD member countries including the U.S. are significantly above the average. To see the full list of the top 10 OECD countries with the largest gender pay gaps, check out this visualization.

-

 Real Estate2 weeks ago
Visualizing America’s Shortage of Affordable Homes
-

 Technology1 week ago
Ranked: Semiconductor Companies by Industry Revenue Share
-

 Money2 weeks ago
Which States Have the Highest Minimum Wage in America?
-

 Real Estate2 weeks ago
Ranked: The Most Valuable Housing Markets in America
-

 Business2 weeks ago
Charted: Big Four Market Share by S&P 500 Audits
-

 AI2 weeks ago
The Stock Performance of U.S. Chipmakers So Far in 2024
-

 Misc2 weeks ago
Almost Every EV Stock is Down After Q1 2024
-

 Money2 weeks ago
Where Does One U.S. Tax Dollar Go?