Markets
How Much Money Do Tourists Spend in Each Country?
How Much Money Do Tourists Spend in Each Country?
There’s so much to see in this world.
From the Grand Canyon to the Ancient Pyramids of Giza, there is at least one mind-blowing attraction to discover anywhere you go. And the countries that have these great tourist attractions? They are happy to see you bring your tourist dollars into their borders.
The question is: just how many dollars are spent, and where?
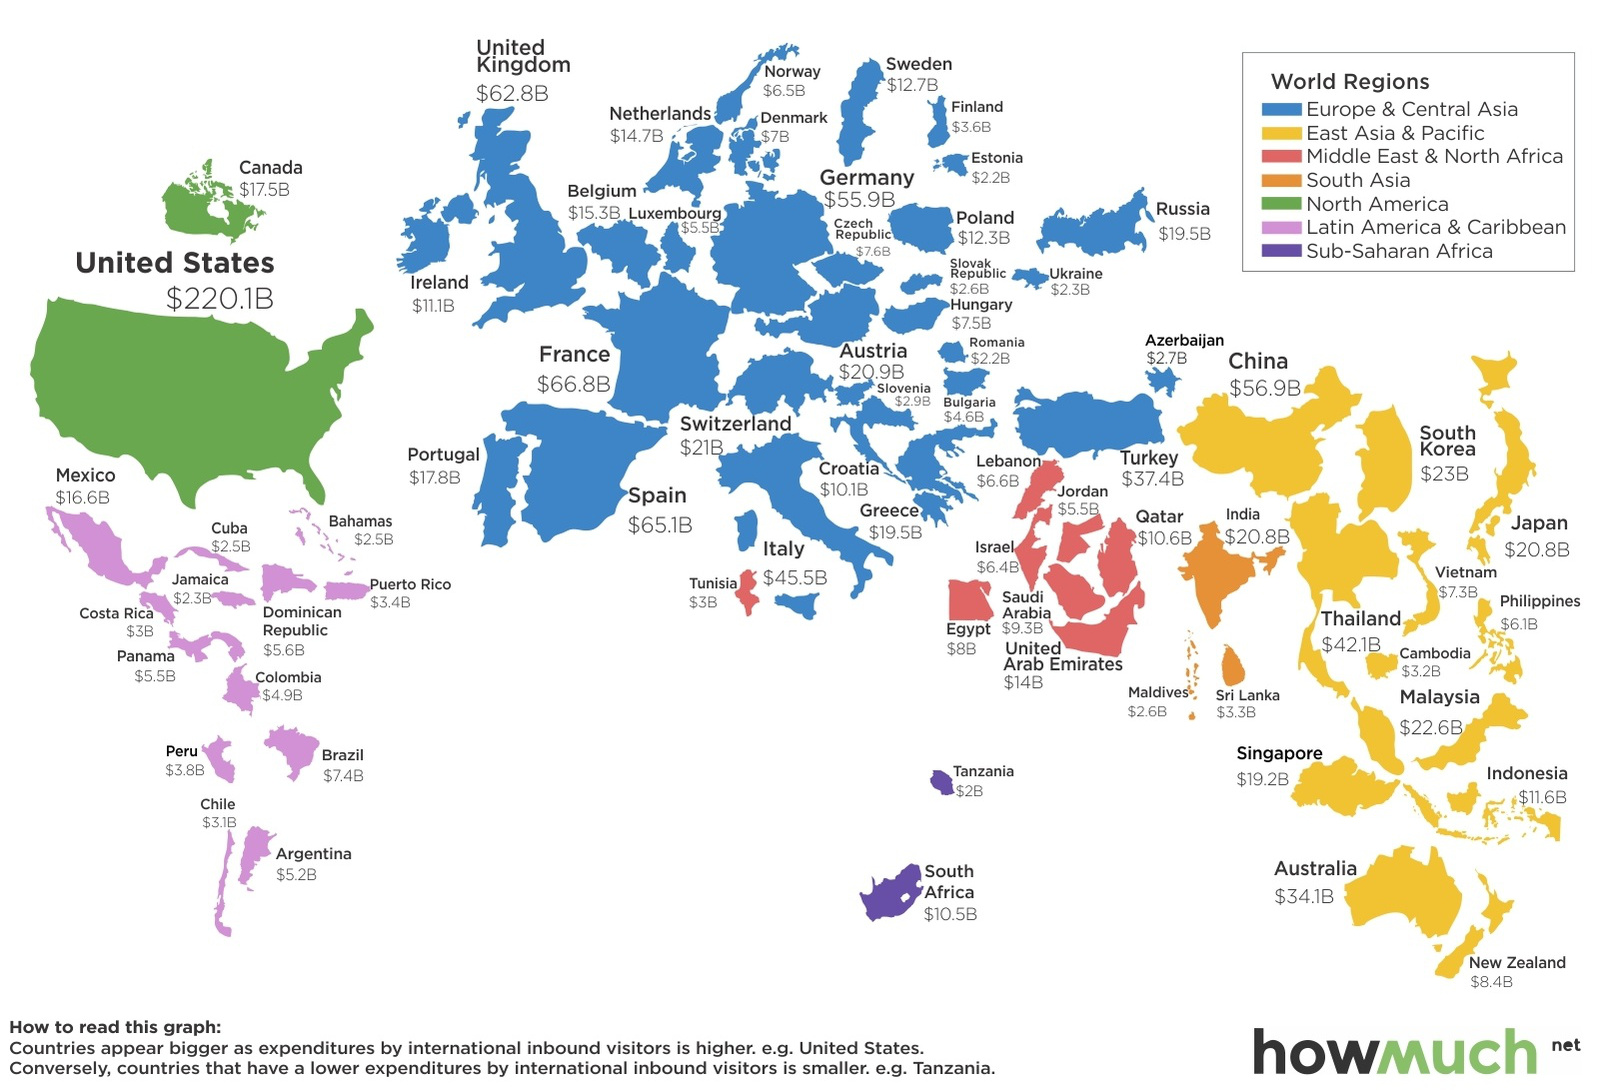
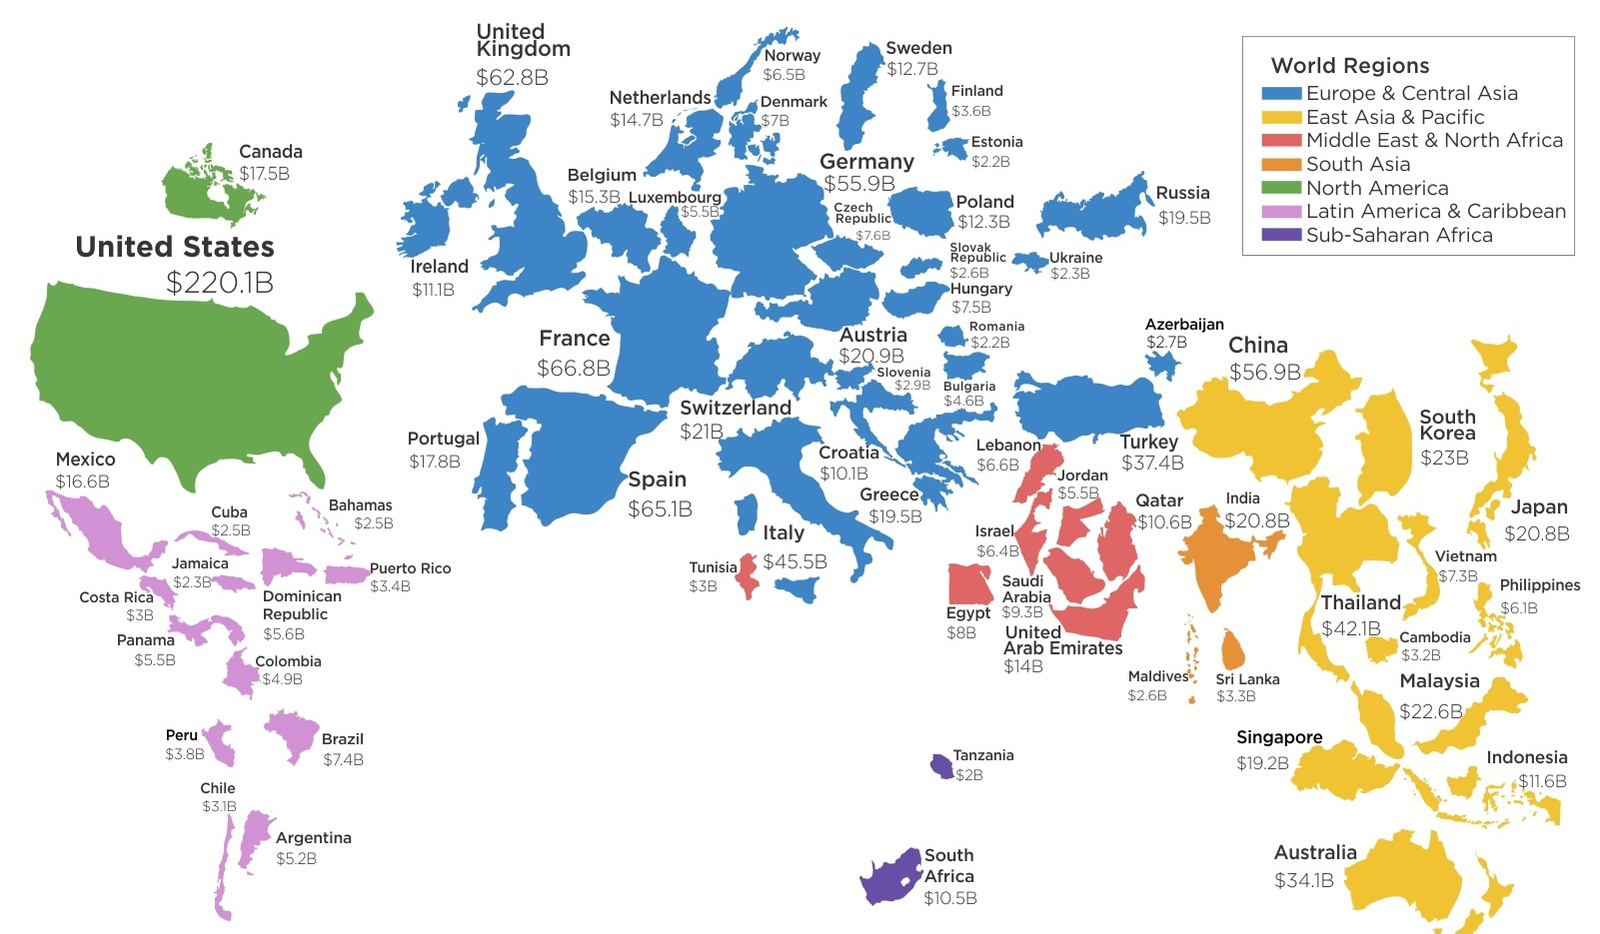
Today’s map comes to us from HowMuch.net, a cost information site, and it shows the countries that rake in the most tourist dollars each year.
Here’s the top five countries:
- The United States brings in $220.1 billion each year from tourists. The country is large and diverse – it offers the bustle of big cities like New York and San Francisco, but it’s also home to cities known for their history or culture, like New Orleans or Washington, DC. Tourists can experience the beaches of SoCal, the madness of Vegas, the serenity of Oregon, the wilderness of Alaska, or the music of Nashville.
- France is a distant second place at $66.8 billion per year. The biggest destinations include Paris, the famous wine regions of Champagne or Bordeaux, the Renaissance city of Lyon, the quayside of Marseilles, or the French Riviera capital of Nice.
- Spain isn’t far behind France, receiving $65.1 billion of tourism expenditures each year. The biggest country on the Iberian Peninsula has more to offer than trips to Ibiza and tapas in Seville. The architecture of Barcelona is magnificent, Madrid is bustling, and there are many hidden cultural gems to be found, such as Moorish monuments and castles throughout the south.
- The United Kingdom has a diverse array of treasures, and that’s why it rakes in $62.8 billion from tourism per year. Tourists can explore the scotch and Highlands of Scotland, or succumb to London calling. The countryside of Wales, the Roman-built pools of Bath, or the fried night foods of Edinburgh all have appeal. This was the home of the Beatles and Shakespeare, after all.
- China tops out Germany by $1 billion to be the fifth-most visited country in terms of tourist dollars spent, with expenditures of $56.9 billion. This is perhaps the biggest surprise on the list – people know China is emerging as the world’s biggest population center and economy, but many do not know it is also a tourist mecca. China gets millions of visitors each year from surrounding Asian countries like South Korea, Japan, Vietnam, Malaysia, and Mongolia. The country also receives significant traffic from Americans and Russians. The Great Wall of China, the Forbidden City, the Three Gorges Dam, and many other sites are high on the list of things to see.


Markets
U.S. Debt Interest Payments Reach $1 Trillion
U.S. debt interest payments have surged past the $1 trillion dollar mark, amid high interest rates and an ever-expanding debt burden.


U.S. Debt Interest Payments Reach $1 Trillion
This was originally posted on our Voronoi app. Download the app for free on iOS or Android and discover incredible data-driven charts from a variety of trusted sources.
The cost of paying for America’s national debt crossed the $1 trillion dollar mark in 2023, driven by high interest rates and a record $34 trillion mountain of debt.
Over the last decade, U.S. debt interest payments have more than doubled amid vast government spending during the pandemic crisis. As debt payments continue to soar, the Congressional Budget Office (CBO) reported that debt servicing costs surpassed defense spending for the first time ever this year.
This graphic shows the sharp rise in U.S. debt payments, based on data from the Federal Reserve.
A $1 Trillion Interest Bill, and Growing
Below, we show how U.S. debt interest payments have risen at a faster pace than at another time in modern history:
| Date | Interest Payments | U.S. National Debt |
|---|---|---|
| 2023 | $1.0T | $34.0T |
| 2022 | $830B | $31.4T |
| 2021 | $612B | $29.6T |
| 2020 | $518B | $27.7T |
| 2019 | $564B | $23.2T |
| 2018 | $571B | $22.0T |
| 2017 | $493B | $20.5T |
| 2016 | $460B | $20.0T |
| 2015 | $435B | $18.9T |
| 2014 | $442B | $18.1T |
| 2013 | $425B | $17.2T |
| 2012 | $417B | $16.4T |
| 2011 | $433B | $15.2T |
| 2010 | $400B | $14.0T |
| 2009 | $354B | $12.3T |
| 2008 | $380B | $10.7T |
| 2007 | $414B | $9.2T |
| 2006 | $387B | $8.7T |
| 2005 | $355B | $8.2T |
| 2004 | $318B | $7.6T |
| 2003 | $294B | $7.0T |
| 2002 | $298B | $6.4T |
| 2001 | $318B | $5.9T |
| 2000 | $353B | $5.7T |
| 1999 | $353B | $5.8T |
| 1998 | $360B | $5.6T |
| 1997 | $368B | $5.5T |
| 1996 | $362B | $5.3T |
| 1995 | $357B | $5.0T |
| 1994 | $334B | $4.8T |
| 1993 | $311B | $4.5T |
| 1992 | $306B | $4.2T |
| 1991 | $308B | $3.8T |
| 1990 | $298B | $3.4T |
| 1989 | $275B | $3.0T |
| 1988 | $254B | $2.7T |
| 1987 | $240B | $2.4T |
| 1986 | $225B | $2.2T |
| 1985 | $219B | $1.9T |
| 1984 | $205B | $1.7T |
| 1983 | $176B | $1.4T |
| 1982 | $157B | $1.2T |
| 1981 | $142B | $1.0T |
| 1980 | $113B | $930.2B |
| 1979 | $96B | $845.1B |
| 1978 | $84B | $789.2B |
| 1977 | $69B | $718.9B |
| 1976 | $61B | $653.5B |
| 1975 | $55B | $576.6B |
| 1974 | $50B | $492.7B |
| 1973 | $45B | $469.1B |
| 1972 | $39B | $448.5B |
| 1971 | $36B | $424.1B |
| 1970 | $35B | $389.2B |
| 1969 | $30B | $368.2B |
| 1968 | $25B | $358.0B |
| 1967 | $23B | $344.7B |
| 1966 | $21B | $329.3B |
Interest payments represent seasonally adjusted annual rate at the end of Q4.
At current rates, the U.S. national debt is growing by a remarkable $1 trillion about every 100 days, equal to roughly $3.6 trillion per year.
As the national debt has ballooned, debt payments even exceeded Medicaid outlays in 2023—one of the government’s largest expenditures. On average, the U.S. spent more than $2 billion per day on interest costs last year. Going further, the U.S. government is projected to spend a historic $12.4 trillion on interest payments over the next decade, averaging about $37,100 per American.
Exacerbating matters is that the U.S. is running a steep deficit, which stood at $1.1 trillion for the first six months of fiscal 2024. This has accelerated due to the 43% increase in debt servicing costs along with a $31 billion dollar increase in defense spending from a year earlier. Additionally, a $30 billion increase in funding for the Federal Deposit Insurance Corporation in light of the regional banking crisis last year was a major contributor to the deficit increase.
Overall, the CBO forecasts that roughly 75% of the federal deficit’s increase will be due to interest costs by 2034.

-

 Markets1 week ago
Ranked: The Largest U.S. Corporations by Number of Employees
-

 Green3 weeks ago
Ranked: Top Countries by Total Forest Loss Since 2001
-

 Money2 weeks ago
Where Does One U.S. Tax Dollar Go?
-

 Automotive2 weeks ago
Almost Every EV Stock is Down After Q1 2024
-

 AI2 weeks ago
The Stock Performance of U.S. Chipmakers So Far in 2024
-

 Markets2 weeks ago
Charted: Big Four Market Share by S&P 500 Audits
-

 Real Estate2 weeks ago
Ranked: The Most Valuable Housing Markets in America
-

 Money2 weeks ago
Which States Have the Highest Minimum Wage in America?