Economy
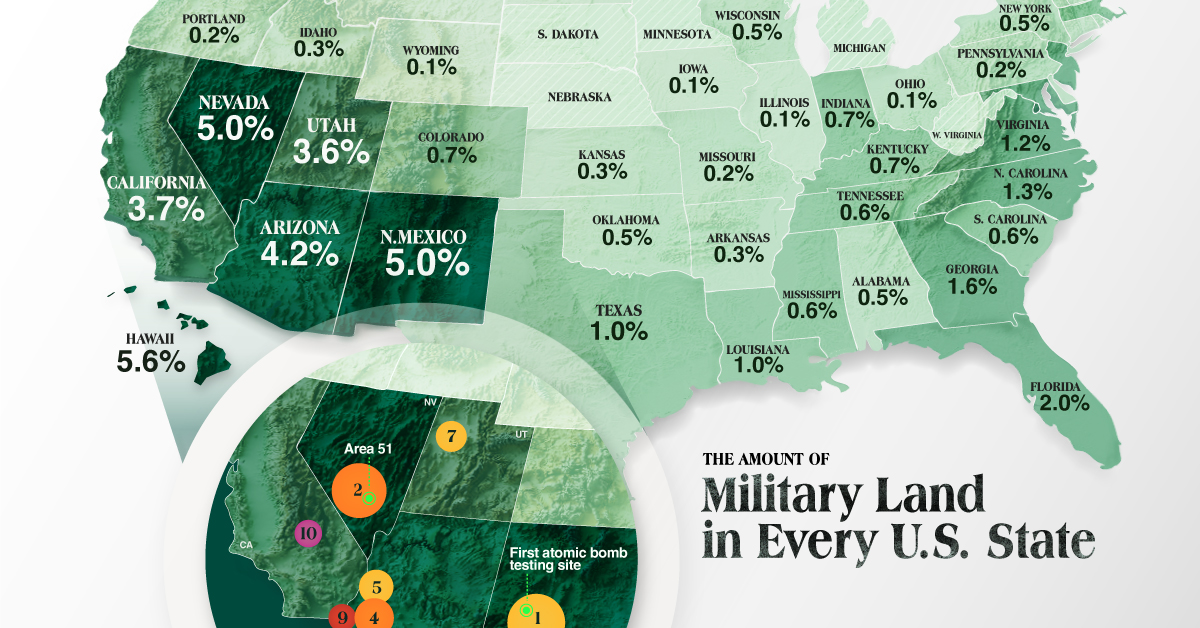
How Much Land does the U.S. Military Control in Each State?
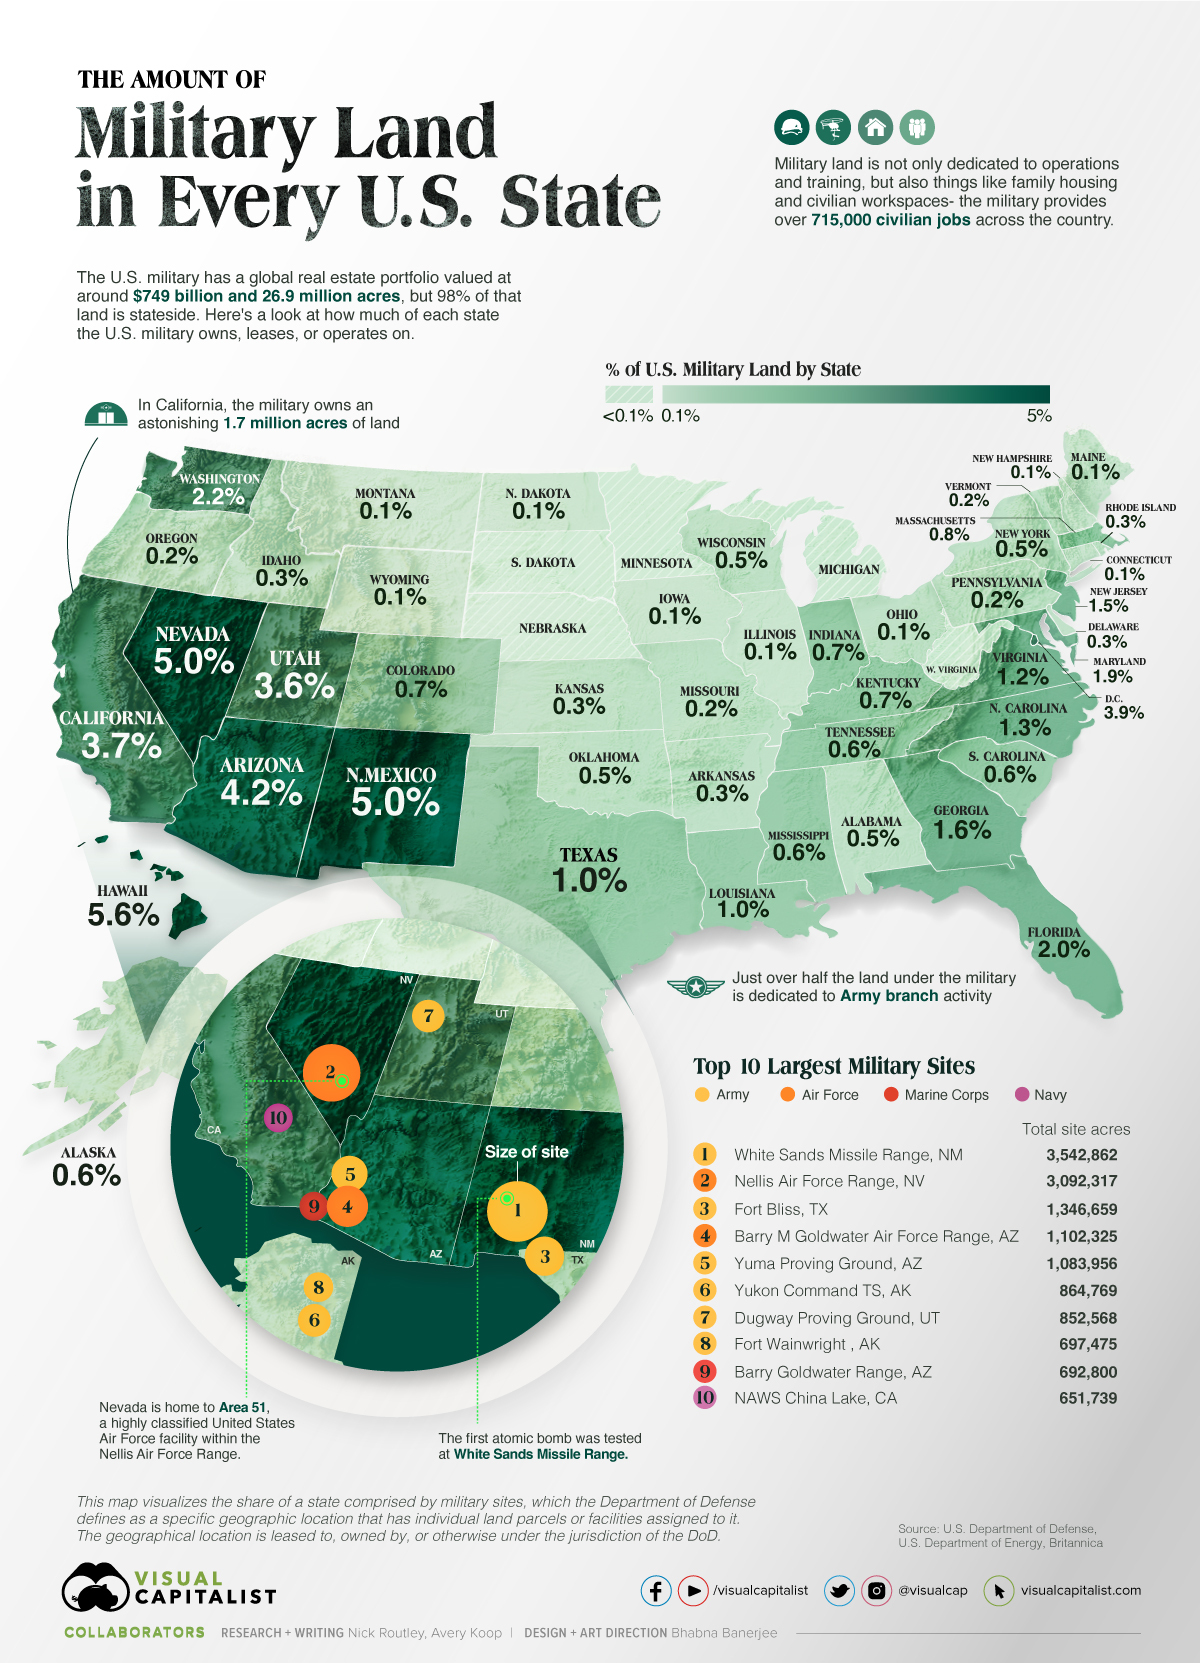


How Much Land does the U.S. Military Own in Each State?
The United States spends an unparalleled amount of money on its military—about $778 billion each year to be precise.
Additionally, the U.S. military also owns, leases, or operates an impressive real estate portfolio with buildings valued at $749 billion and a land area of 26.9 million acres, of which around 98% is located within the United States.
This visual, using data from the Department of Defense (DoD) reveals how much of each state the U.S. military owns, leases, or operates on.
This map visualizes the share of a state comprised by military sites, which the Department of Defense defines as a specific geographic location that has individual land parcels or facilities assigned to it. The geographical location is leased to, owned by, or otherwise under the jurisdiction of the DoD.
What is Military Land Used For?
The DoD is the larger government umbrella under which the military falls and the department operates on over 26 million acres of land stateside.
To further break it down the U.S. military is divided into four main branches:
- Army
- Navy
- Air Force
- Marine Corps
There is also the Space Force, the Coast Guard, and the National Guard. However, most of the land is dedicated to the Army, which is the military’s largest branch.
Military bases are used for training and housing soldiers, testing weapons and equipment, conducting research, and running active operations, among other things. A large majority of the square footage is actually designated for family housing.
For example, Fort Bragg, North Carolina, which is one of the most famous U.S. Army bases, is home to more than 260,000 people including the families of soldiers. The base, which is virtually its own city, is the largest U.S. Army installation with 53,700 troops—nearly 10% of the Army—and over 14,000 civilian employees.
Which States Have the Biggest Military Presence?
Looking at the largest total sites, the top 10 combined cover an astonishing 13,927,470 acres, larger than 10 individual states including New Jersey, Massachusetts, and Hawaii.
Here’s a look at the size of the military’s sites in each state and how much of that state’s land the sites take up:
| State | Site (Acres) | Share of State's Total Land |
|---|---|---|
| Hawaii | 228,639 | 5.6% |
| Nevada | 3,541,949 | 5.0% |
| New Mexico | 3,889,638 | 5.0% |
| Arizona | 3,042,028 | 4.2% |
| District of Columbia | 1,525 | 3.9% |
| California | 3,655,180 | 3.7% |
| Utah | 1,883,234 | 3.6% |
| Washington | 941,146 | 2.2% |
| Florida | 690,994 | 2.0% |
| Maryland | 115,158 | 1.9% |
| Georgia | 589,060 | 1.6% |
| New Jersey | 71,822 | 1.5% |
| North Carolina | 411,152 | 1.3% |
| Virginia | 289,815 | 1.2% |
| Texas | 1,690,725 | 1.0% |
| Louisiana | 272,357 | 1.0% |
| Massachusetts | 39,107 | 0.8% |
| Colorado | 476,056 | 0.7% |
| Kentucky | 180,852 | 0.7% |
| Indiana | 160,103 | 0.7% |
| Mississippi | 176,745 | 0.6% |
| South Carolina | 109,938 | 0.6% |
| Alaska | 2,057,351 | 0.6% |
| Tennessee | 147,839 | 0.6% |
| Alabama | 166,800 | 0.5% |
| Oklahoma | 223,632 | 0.5% |
| New York | 152,611 | 0.5% |
| Wisconsin | 155,500 | 0.5% |
| Rhode Island | 2,280 | 0.3% |
| Delaware | 4,170 | 0.3% |
| Kansas | 140,973 | 0.3% |
| Arkansas | 88,072 | 0.3% |
| Idaho | 136,350 | 0.3% |
| Oregon | 140,294 | 0.2% |
| Pennsylvania | 61,323 | 0.2% |
| Missouri | 88,240 | 0.2% |
| Vermont | 1,1520 | 0.2% |
| Ohio | 35,150 | 0.1% |
| Maine | 18,742 | 0.1% |
| Illinois | 31,165 | 0.1% |
| North Dakota | 31,937 | 0.1% |
| Iowa | 24,506 | 0.1% |
| Montana | 56,998 | 0.1% |
| Connecticut | 1,753 | 0.1% |
| New Hampshire | 3,225 | 0.1% |
| Wyoming | 31,984 | 0.1% |
| Nebraska | 21,272 | 0.04% |
| Michigan | 14,004 | 0.04% |
| West Virginia | 3,084 | 0.02% |
| South Dakota | 9,681 | 0.02% |
| Minnesota | 2,736 | 0.01% |
In Hawaii, 5.6% of the state belongs to the military. The historic Pearl Harbor on the island of Oahu is still an active base, housing both the Navy and the Air Force.
In the nation’s capital, Washington D.C., 3.9% of the small district is owned or operated on by the military—there are approximately 18 independent sites in the city.
Most of the DoD’s land is in the southwestern United States. One major benefit is that there are areas large enough in these states to test hugely destructive weapons without harming anyone. The atomic bomb was first detonated in the middle of nowhere in New Mexico at the White Sands Missile Range, the biggest military site in the country.
Almost all of the largest military sites fall under the Army branch, which has over 415,000 active personnel. Here’s a look at the U.S. military breakdown in terms of population:
- Active Duty:
- Army: 415,967
- Navy: 304,118
- Marine Corps: 146,728
- Air Force (also includes Space Force): 273,983
- Coast Guard: 38,829
- Reserves: 438,645
Beyond just the presence of soldiers across the states, the military also represents a lot of jobs. In total, both on U.S. soil and globally the DoD provides nearly 2.9 million jobs from active duty troops to civilian positions within the military. In California, for example, the military provides over 62,000 civilian jobs.
U.S. Military Presence Beyond its Borders
When it comes to all the land that the military both owns and leases globally, the figure is huge, coming out to 26.9 million acres. The Army controls 51% of the DoD’s land, followed by the Air Force’s 32%.
Military land owned by the DoD can be found outside the U.S. in 8 territories and 45 foreign countries. Here’s a breakdown of where the majority of the U.S.’ foreign bases are:
- 🇩🇪 Germany: 194 sites
- 🇯🇵 Japan: 121 sites
- 🇰🇷 South Korea: 83 sites
In places where there are ongoing conflicts, the U.S. has a few permanent forces. In regular times in Ukraine, there are 23 active duty soldiers permanently stationed. In Russia there are 41 active duty U.S. troops. However, President Joe Biden has recently announced that he will increase the U.S.’ military presence across Europe because of the war in Ukraine.


Copper
Brass Rods: The Secure Choice
This graphic shows why brass rods are the secure choice for precision-machined and forged parts.


Brass Rods: The Secure Choice
The unique combination of machinability and recyclability makes brass rods the secure choice for manufacturers seeking future-proof raw material solutions.
This infographic, from the Copper Development Association, shows three ways brass rods give manufacturers greater control and a license to grow in the competitive market for precision-machined and forged products.
Future-Proof Investments in New Machine Tools
A material’s machinability directly impacts machine throughput, which typically has the largest impact on machine shop profitability.
The high-speed machining capabilities of brass rods maximize machine tool performance, allowing manufacturers to run the material faster and longer without sacrificing tool life, chip formation, or surface quality.
The high machining efficiency of brass leads to reduced per-part costs, quicker return on investment (ROI) for new machine tools, and expanded production capacity for new projects.
Supply Security Through Closed Loop Recycling
Brass, like its parent element copper, can be infinitely recycled.
In 2022, brass- and wire-rod mills accounted for the majority of the 830,000 tonnes of copper recycled from scrap in the United States.
Given that scrap ratios for machined parts typically range from 60-70% by weight, producing mills benefit from a secure and steady supply of clean scrap returned directly from customers, which is recycled to create new brass rods.
The high residual value of brass scrap creates a strong recycling incentive. Scrap buy back programs give manufacturers greater control over raw material net costs as scrap value is often factored into supplier purchase agreements.
Next Generation Alloys for a Lead-Free Future
Increasingly stringent global regulations continue to pressure manufacturers to minimize the use of materials containing trace amounts of lead and other harmful impurities.
The latest generation of brass-rod alloys is engineered to meet the most demanding criteria for lead leaching in drinking water and other sensitive applications.
Seven brass-rod alloys passed rigorous testing to become the only ‘Acceptable Materials’ against lower lead leaching criteria recently adopted in the national U.S. drinking water quality standard, NSF 61.
Learn more about the advantages of brass rods solutions.

-

 Base Metals1 year ago
Ranked: The World’s Largest Copper Producers
Many new technologies critical to the energy transition rely on copper. Here are the world’s largest copper producers.
-

 Silver2 years ago
Mapped: Solar Power by Country in 2021
In 2020, solar power saw its largest-ever annual capacity expansion at 127 gigawatts. Here’s a snapshot of solar power capacity by country.
-

 Batteries5 years ago
Visualizing Copper’s Role in the Transition to Clean Energy
A clean energy transition is underway as wind, solar, and batteries take center stage. Here’s how copper plays the critical role in these technologies.
-

 Science5 years ago
Everything You Need to Know on VMS Deposits
Deep below the ocean’s waves, VMS deposits spew out massive amounts of minerals like copper, zinc, and gold, making them a key source of the metals…
-
 Copper5 years ago
How Much Copper is in an Electric Vehicle?
Have you ever wondered how much copper is in an electric vehicle? This infographic shows the metal’s properties as well as the quantity of copper used.
-
 Copper6 years ago
Copper: Driving the Green Energy Revolution
Renewable energy is set to fuel a new era of copper demand – here’s how much copper is used in green applications from EVs to photovoltaics.


-

 Green2 weeks ago
Ranked: Top Countries by Total Forest Loss Since 2001
-

 Travel1 week ago
Ranked: The World’s Top Flight Routes, by Revenue
-

 Technology2 weeks ago
Ranked: Semiconductor Companies by Industry Revenue Share
-

 Money2 weeks ago
Which States Have the Highest Minimum Wage in America?
-

 Real Estate2 weeks ago
Ranked: The Most Valuable Housing Markets in America
-

 Markets2 weeks ago
Charted: Big Four Market Share by S&P 500 Audits
-

 AI2 weeks ago
The Stock Performance of U.S. Chipmakers So Far in 2024
-

 Automotive2 weeks ago
Almost Every EV Stock is Down After Q1 2024