Markets
World Beer Index 2021: What’s the Beer Price in Your Country?
What’s the Beer Price in Your Country?
Although fewer people have been able to grab a beer at the pub during this pandemic, the global desire for beer prevails. For example, sales of the Corona beer actually shot up in the past year, despite—or perhaps because of—associations with the coronavirus.
This World Beer Index from Expensivity compares the average price of a bottle of beer in 58 countries in a detailed map. Additionally, we show which countries spend the most on beer per capita, and just how much beer people really drink.
Pricey Pints: The Average Beer Price
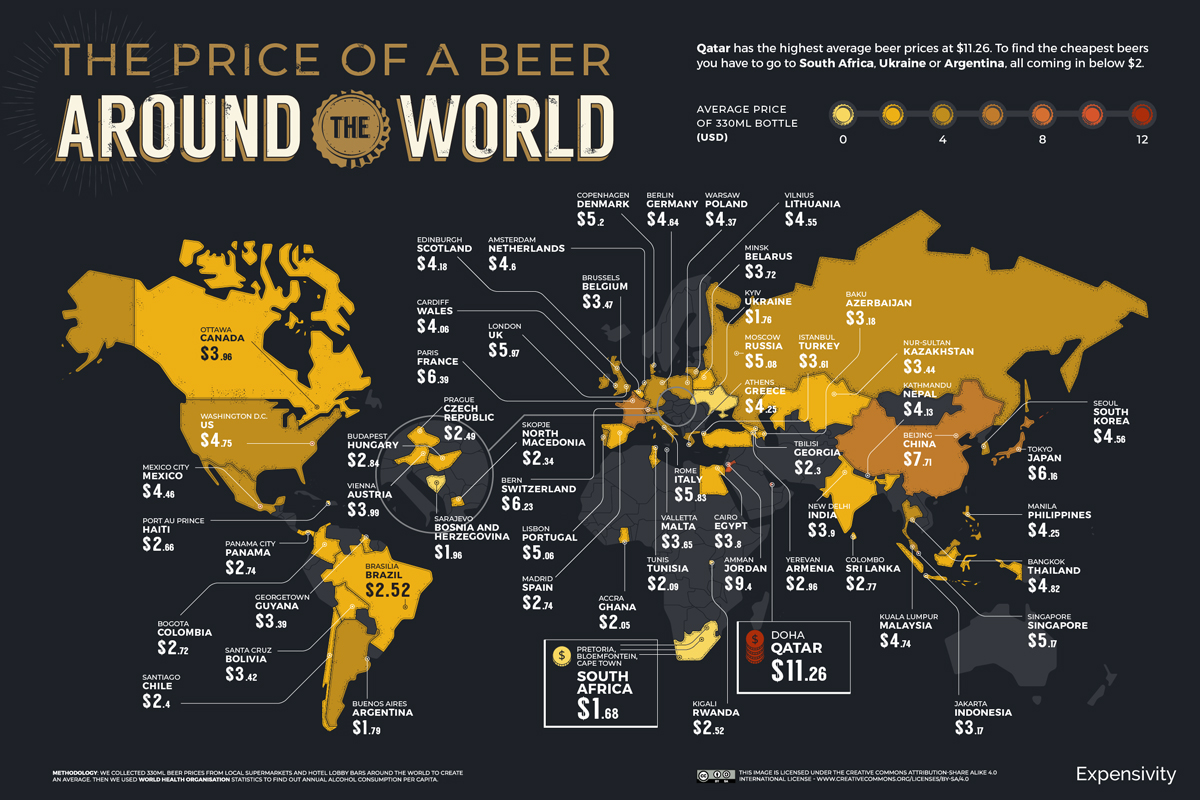
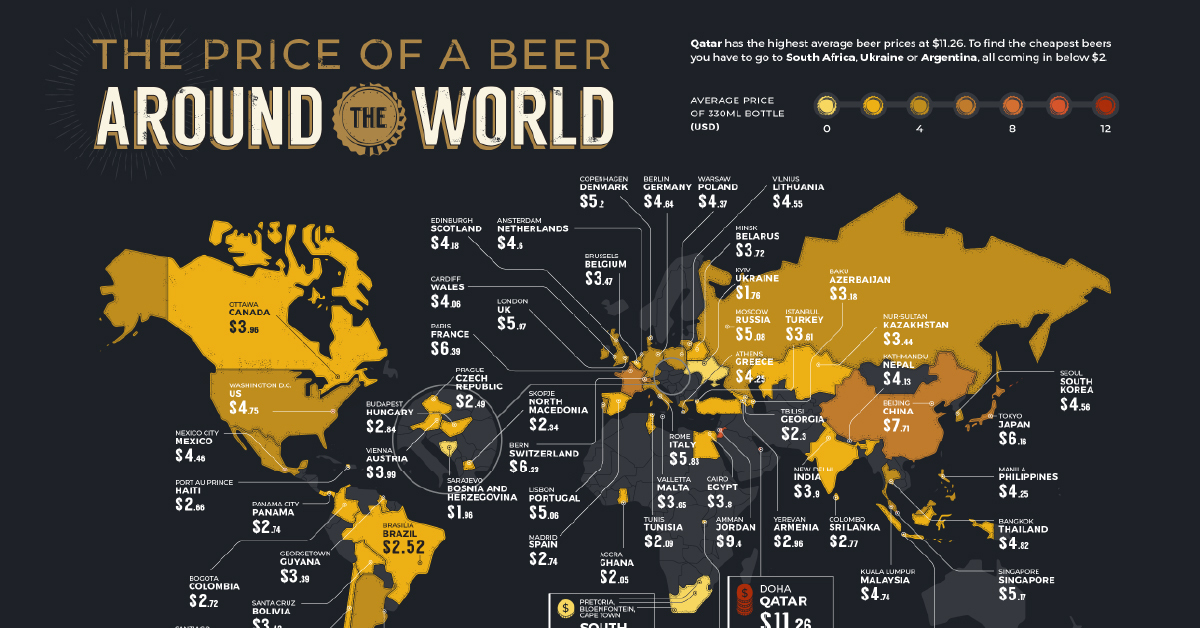
Researchers calculated the average price of a typical bottle of beer (330ml, just shy of a pint) from well known brands via online stores and statistics database Numbeo. In addition, local beer prices were pulled from hotel and bar menus, and average values converted to USD.
In Qatar, you’d have to shell out $11.26 for a single beer, which would surely make for a really expensive night out on the town. In part, this is because in 2019, the Muslim-majority country introduced a 100% excise tax on top the previous sales price of all alcohol imports.
These steep prices are aimed at tourists—and with Qatar hosting the 2022 men’s soccer World Cup, there’ll be thousands of visitors in the country looking for a cold one at any price.
| Rank | Country | Capital City | Average Price of a Beer |
|---|---|---|---|
| 1 | South Africa | Pretoria, Bloemfontein, Cape Town | $1.68 |
| 2 | Ukraine | Kyiv | $1.76 |
| 3 | Argentina | Buenos Aires | $1.79 |
| 4 | Bosnia And Herzegovina | Sarajevo | $1.96 |
| 5 | Ghana | Accra | $2.05 |
| 6 | Tunisia | Tunis | $2.09 |
| 7 | Georgia | Tbilisi | $2.30 |
| 8 | North Macedonia | Skopje | $2.34 |
| 9 | Chile | Santiago | $2.40 |
| 10 | Czech Republic (Czechia) | Prague | $2.49 |
| 11 | Rwanda | Kigali | $2.52 |
| 12 | Brazil | Brasilia | $2.52 |
| 13 | Haiti | Port Au Prince | $2.66 |
| 14 | Colombia | Bogota | $2.72 |
| 15 | Spain | Madrid | $2.74 |
| 16 | Panama | Panama City | $2.74 |
| 17 | Sri Lanka | Colombo | $2.77 |
| 18 | Hungary | Budapest | $2.84 |
| 19 | Armenia | Yerevan | $2.96 |
| 20 | Indonesia | Jakarta | $3.17 |
| 21 | Azerbaijan | Baku | $3.18 |
| 22 | Guyana | Georgetown | $3.39 |
| 23 | Bolivia | Santa Cruz | $3.42 |
| 24 | Kazakhstan | Nur-Sultan | $3.44 |
| 25 | Belgium | Brussels | $3.47 |
| 26 | Turkey | Istanbul | $3.61 |
| 27 | Malta | Valletta | $3.65 |
| 28 | Belarus | Minsk | $3.72 |
| 29 | Egypt | Cairo | $3.80 |
| 30 | India | New Delhi | $3.90 |
| 31 | Canada | Ottawa | $3.96 |
| 32 | Austria | Vienna | $3.99 |
| 33 | Wales | Cardiff | $4.06 |
| 34 | Nepal | Kathmandu | $4.13 |
| 35 | Scotland | Edinburgh | $4.18 |
| 36 | Greece | Athens | $4.25 |
| 37 | Philippines | Manila | $4.25 |
| 38 | Poland | Warsaw | $4.37 |
| 39 | Mexico | Mexcio City | $4.46 |
| 40 | Lithuania | Vilnius | $4.55 |
| 41 | South Korea | Seoul | $4.56 |
| 42 | Netherlands | Amsterdam | $4.60 |
| 43 | Germany | Berlin | $4.64 |
| 44 | Malaysia | Kuala Lumpur | $4.74 |
| 45 | United States | Washington D.C. | $4.75 |
| 46 | Thailand | Bangkok | $4.82 |
| 47 | Portugal | Lisbon | $5.06 |
| 48 | Russia | Moscow | $5.08 |
| 49 | Singapore | Singapore | $5.17 |
| 50 | Denmark | Copenhagen | $5.20 |
| 51 | Italy | Rome | $5.83 |
| 52 | England | London | $5.97 |
| 53 | Japan | Tokyo | $6.16 |
| 54 | Switzerland | Bern | $6.23 |
| 55 | France | Paris | $6.39 |
| 56 | China | Beijing | $7.71 |
| 57 | Jordan | Amman | $9.40 |
| 58 | Qatar | Doha | $11.26 |
At just $1.68 per bottle, South Africa has the lowest average beer price thanks at least partially to cultural norms of buying in bulk.
Cashing In: The Per Capita Spend on Beer
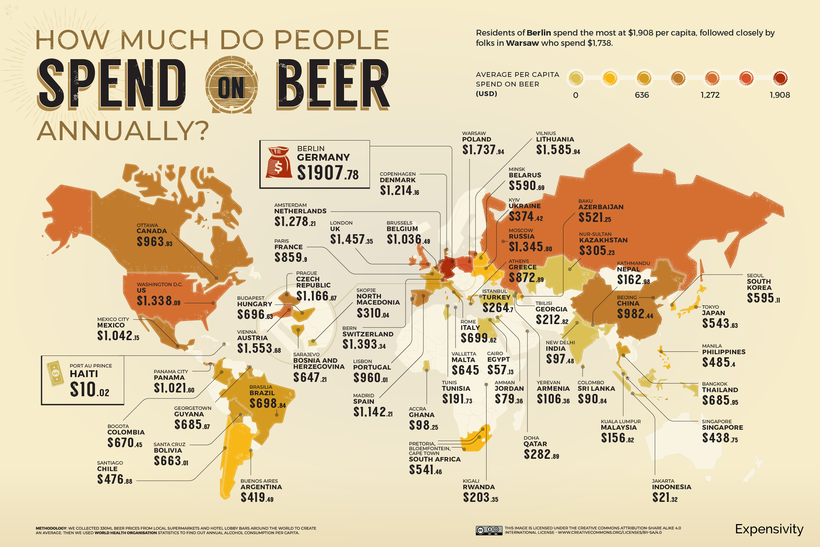
The price of a single beer is one thing, but which countries spend the most on beer itself? Germany unsurprisingly tops the list here with nearly $2,000 of expenditures per capita, bolstered by its strong beer culture and annual Oktoberfest celebration.
Germany also prides itself on the purity of its beer—the vast majority of brewers follow the Reinheitsgebot, centuries-old purity laws that broadly state that beer may contain only three ingredients: water, barley, and hops.
View the high resolution of this infographic by clicking here.
Following closely behind is Poland, which spends $1,738 per capita. Meanwhile, the U.S. ranks eighth in the world for the highest spending on beer per capita at $1,554—beer is also the country’s most popular alcoholic beverage.
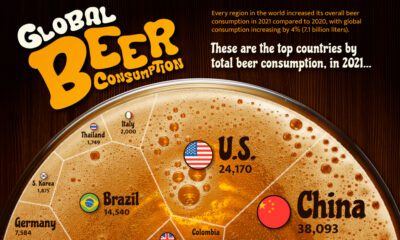
Getting Boozy: How Much Beer Do People Drink?
Using data from the World Health Organization, the visualization below also digs into how much beer is consumed around the world per capita.
The Czech Republic emerges on top in this regard, with 468 beers on average in a year—that works out to 1.3 beers per day. Spain and Germany are next with 417 and 411 beers, respectively.

View the high resolution of this infographic by clicking here.
On the flip side, people in Haiti only drink about four beers yearly. This may be because they prefer something a little stronger—97% of alcohol consumption in the nation comes from spirits such as rum.
Beer has been around for over 7,000 years. No matter the beer price in your country, it’s worth raising a glass to the timelessness of this humble beverage.


Markets
U.S. Debt Interest Payments Reach $1 Trillion
U.S. debt interest payments have surged past the $1 trillion dollar mark, amid high interest rates and an ever-expanding debt burden.


U.S. Debt Interest Payments Reach $1 Trillion
This was originally posted on our Voronoi app. Download the app for free on iOS or Android and discover incredible data-driven charts from a variety of trusted sources.
The cost of paying for America’s national debt crossed the $1 trillion dollar mark in 2023, driven by high interest rates and a record $34 trillion mountain of debt.
Over the last decade, U.S. debt interest payments have more than doubled amid vast government spending during the pandemic crisis. As debt payments continue to soar, the Congressional Budget Office (CBO) reported that debt servicing costs surpassed defense spending for the first time ever this year.
This graphic shows the sharp rise in U.S. debt payments, based on data from the Federal Reserve.
A $1 Trillion Interest Bill, and Growing
Below, we show how U.S. debt interest payments have risen at a faster pace than at another time in modern history:
| Date | Interest Payments | U.S. National Debt |
|---|---|---|
| 2023 | $1.0T | $34.0T |
| 2022 | $830B | $31.4T |
| 2021 | $612B | $29.6T |
| 2020 | $518B | $27.7T |
| 2019 | $564B | $23.2T |
| 2018 | $571B | $22.0T |
| 2017 | $493B | $20.5T |
| 2016 | $460B | $20.0T |
| 2015 | $435B | $18.9T |
| 2014 | $442B | $18.1T |
| 2013 | $425B | $17.2T |
| 2012 | $417B | $16.4T |
| 2011 | $433B | $15.2T |
| 2010 | $400B | $14.0T |
| 2009 | $354B | $12.3T |
| 2008 | $380B | $10.7T |
| 2007 | $414B | $9.2T |
| 2006 | $387B | $8.7T |
| 2005 | $355B | $8.2T |
| 2004 | $318B | $7.6T |
| 2003 | $294B | $7.0T |
| 2002 | $298B | $6.4T |
| 2001 | $318B | $5.9T |
| 2000 | $353B | $5.7T |
| 1999 | $353B | $5.8T |
| 1998 | $360B | $5.6T |
| 1997 | $368B | $5.5T |
| 1996 | $362B | $5.3T |
| 1995 | $357B | $5.0T |
| 1994 | $334B | $4.8T |
| 1993 | $311B | $4.5T |
| 1992 | $306B | $4.2T |
| 1991 | $308B | $3.8T |
| 1990 | $298B | $3.4T |
| 1989 | $275B | $3.0T |
| 1988 | $254B | $2.7T |
| 1987 | $240B | $2.4T |
| 1986 | $225B | $2.2T |
| 1985 | $219B | $1.9T |
| 1984 | $205B | $1.7T |
| 1983 | $176B | $1.4T |
| 1982 | $157B | $1.2T |
| 1981 | $142B | $1.0T |
| 1980 | $113B | $930.2B |
| 1979 | $96B | $845.1B |
| 1978 | $84B | $789.2B |
| 1977 | $69B | $718.9B |
| 1976 | $61B | $653.5B |
| 1975 | $55B | $576.6B |
| 1974 | $50B | $492.7B |
| 1973 | $45B | $469.1B |
| 1972 | $39B | $448.5B |
| 1971 | $36B | $424.1B |
| 1970 | $35B | $389.2B |
| 1969 | $30B | $368.2B |
| 1968 | $25B | $358.0B |
| 1967 | $23B | $344.7B |
| 1966 | $21B | $329.3B |
Interest payments represent seasonally adjusted annual rate at the end of Q4.
At current rates, the U.S. national debt is growing by a remarkable $1 trillion about every 100 days, equal to roughly $3.6 trillion per year.
As the national debt has ballooned, debt payments even exceeded Medicaid outlays in 2023—one of the government’s largest expenditures. On average, the U.S. spent more than $2 billion per day on interest costs last year. Going further, the U.S. government is projected to spend a historic $12.4 trillion on interest payments over the next decade, averaging about $37,100 per American.
Exacerbating matters is that the U.S. is running a steep deficit, which stood at $1.1 trillion for the first six months of fiscal 2024. This has accelerated due to the 43% increase in debt servicing costs along with a $31 billion dollar increase in defense spending from a year earlier. Additionally, a $30 billion increase in funding for the Federal Deposit Insurance Corporation in light of the regional banking crisis last year was a major contributor to the deficit increase.
Overall, the CBO forecasts that roughly 75% of the federal deficit’s increase will be due to interest costs by 2034.

-

 Real Estate2 weeks ago
Visualizing America’s Shortage of Affordable Homes
-

 Technology1 week ago
Ranked: Semiconductor Companies by Industry Revenue Share
-

 Money2 weeks ago
Which States Have the Highest Minimum Wage in America?
-

 Real Estate2 weeks ago
Ranked: The Most Valuable Housing Markets in America
-

 Business2 weeks ago
Charted: Big Four Market Share by S&P 500 Audits
-

 AI2 weeks ago
The Stock Performance of U.S. Chipmakers So Far in 2024
-

 Misc2 weeks ago
Almost Every EV Stock is Down After Q1 2024
-

 Money2 weeks ago
Where Does One U.S. Tax Dollar Go?