Technology
How Much Data is Generated Each Day?
View the full-size version of the infographic
How Much Data is Generated Each Day?
View the full-size version of the infographic by clicking here
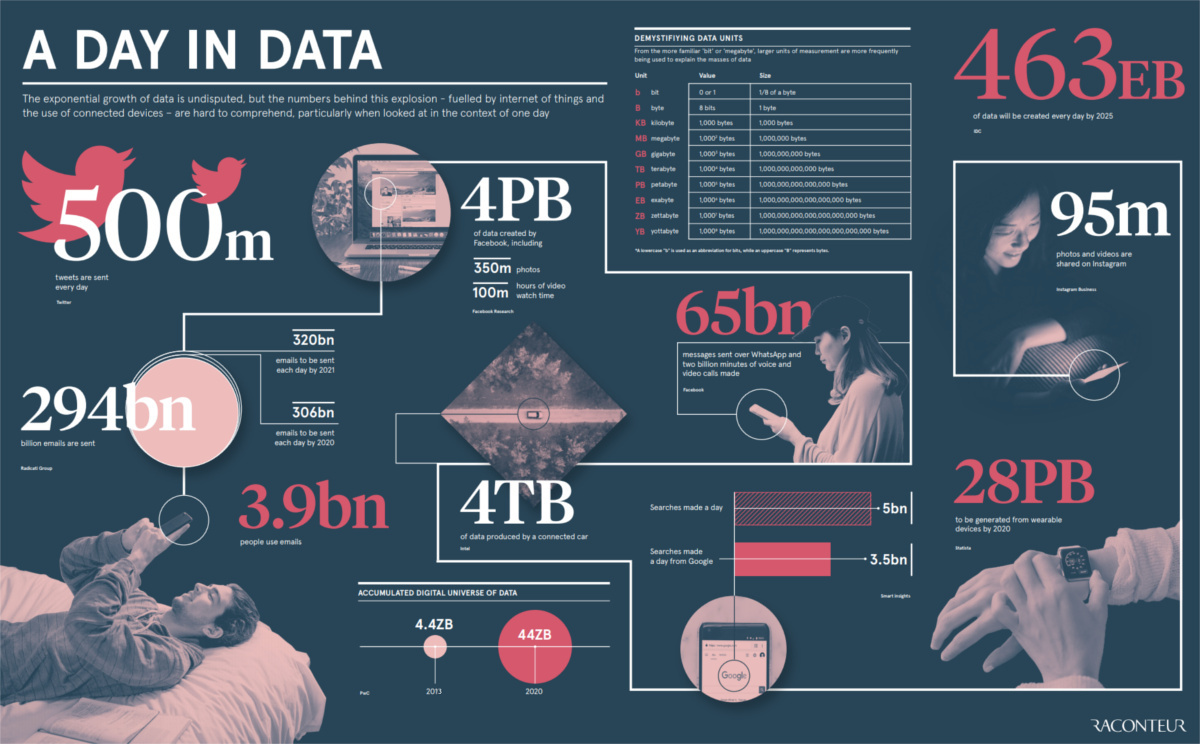
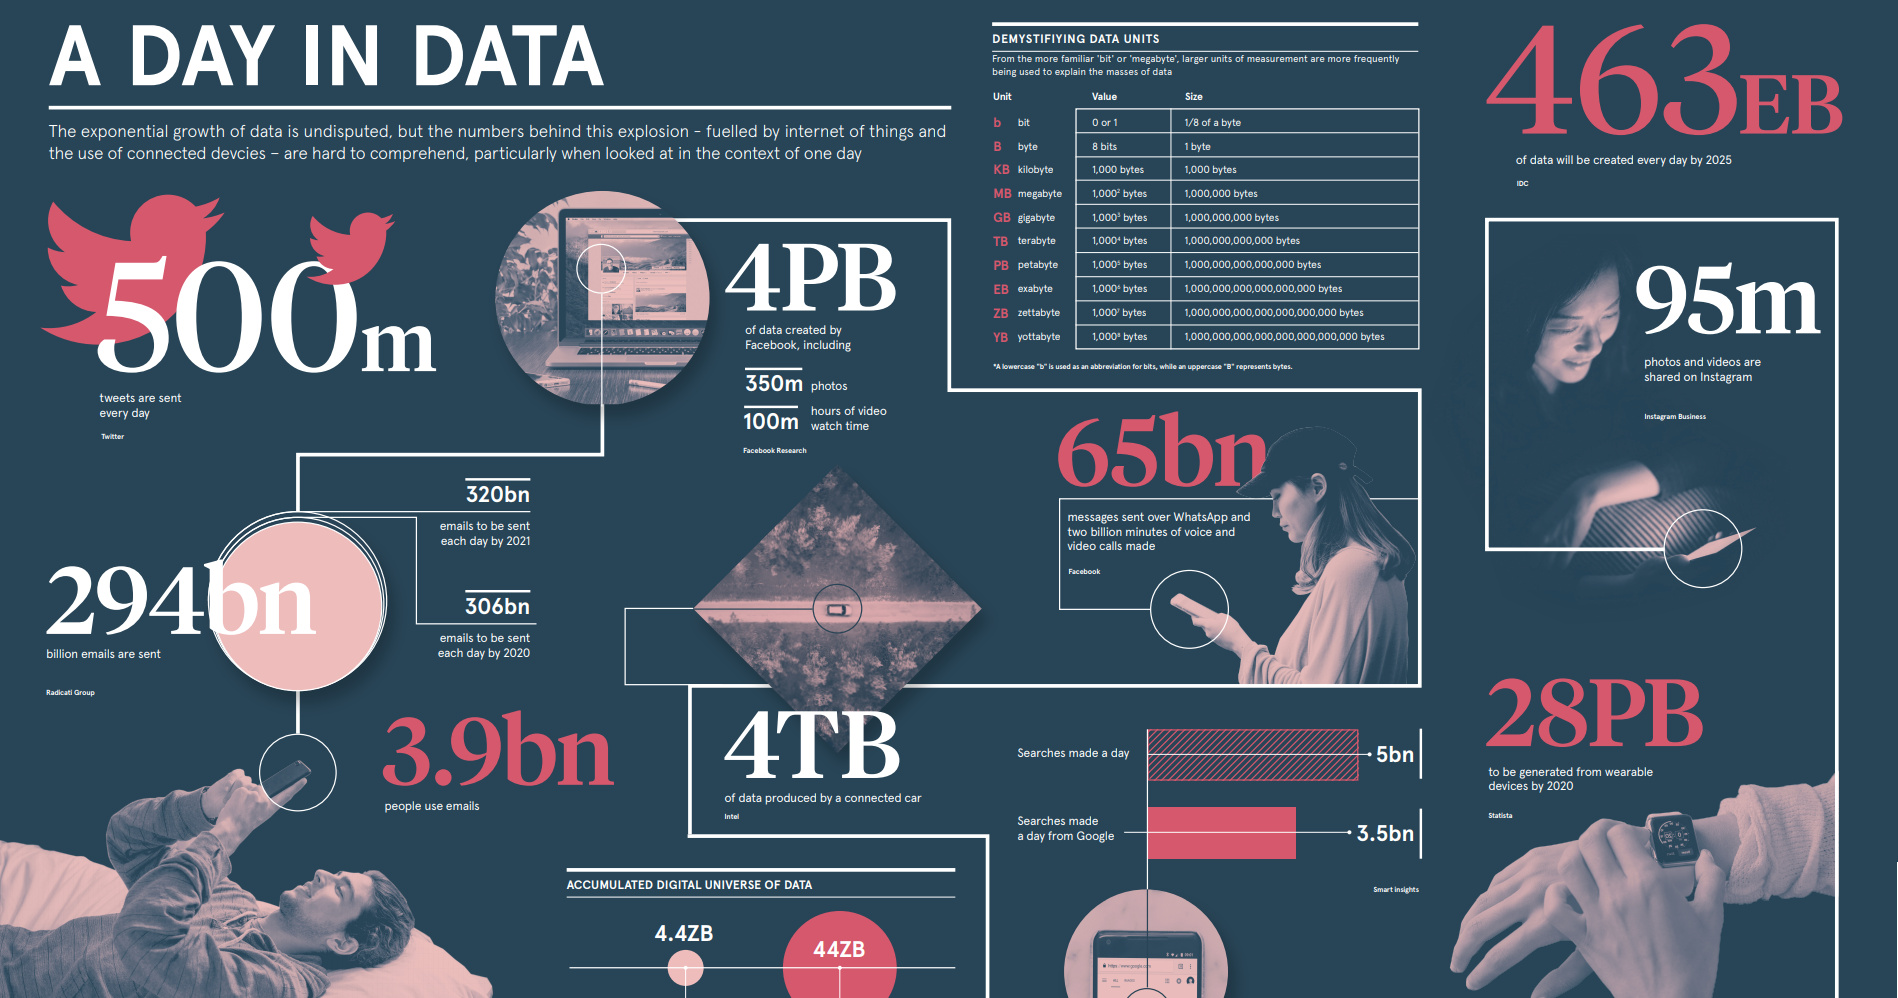
You’ve probably heard of kilobytes, megabytes, gigabytes, or even terabytes.
These data units are common everyday amounts that the average person may run into. Units this size may be big enough to quantify the amount of data sent in an email attachment, or the data stored on a hard drive, for example.
In the coming years, however, these common units will begin to seem more quaint – that’s because the entire digital universe is expected to reach 44 zettabytes by 2020.
If this number is correct, it will mean there are 40 times more bytes than there are stars in the observable universe.
A Crash Course in Data
Today’s infographic comes to us from Raconteur, and it gives us a picture of this new data reality.
Before we get to how much data is created each day – both now, and in the future – it’s worth getting acquainted with how data scales in terms of units.
| Abbreviation | Unit | Value | Size (in bytes) |
|---|---|---|---|
| b | bit | 0 or 1 | 1/8 of a byte |
| B | bytes | 8 bits | 1 byte |
| KB | kilobytes | 1,000 bytes | 1,000 bytes |
| MB | megabyte | 1,000² bytes | 1,000,000 bytes |
| GB | gigabyte | 1,000³ bytes | 1,000,000,000 bytes |
| TB | terabyte | 1,000⁴ bytes | 1,000,000,000,000 bytes |
| PB | petabyte | 1,000⁵ bytes | 1,000,000,000,000,000 bytes |
| EB | exabyte | 1,000⁶ bytes | 1,000,000,000,000,000,000 bytes |
| ZB | zettabyte | 1,000⁷ bytes | 1,000,000,000,000,000,000,000 bytes |
| YB | yottabyte | 1,000⁸ bytes | 1,000,000,000,000,000,000,000,000 bytes |
There’s no doubt that data literacy will only become more important in the future, so make sure you know your zettabytes from your yottabytes!
A Day of Data
How much data is generated in a day – and what could this look like as we enter an even more data-driven future?
Here are some key daily statistics highlighted in the infographic:
- 500 million tweets are sent
- 294 billion emails are sent
- 4 petabytes of data are created on Facebook
- 4 terabytes of data are created from each connected car
- 65 billion messages are sent on WhatsApp
- 5 billion searches are made
By 2025, it’s estimated that 463 exabytes of data will be created each day globally – that’s the equivalent of 212,765,957 DVDs per day!
If you think the above information is fascinating, see what happens in an internet minute.


Technology
Ranked: Semiconductor Companies by Industry Revenue Share
Nvidia is coming for Intel’s crown. Samsung is losing ground. AI is transforming the space. We break down revenue for semiconductor companies.


Semiconductor Companies by Industry Revenue Share
This was originally posted on our Voronoi app. Download the app for free on Apple or Android and discover incredible data-driven charts from a variety of trusted sources.
Did you know that some computer chips are now retailing for the price of a new BMW?
As computers invade nearly every sphere of life, so too have the chips that power them, raising the revenues of the businesses dedicated to designing them.
But how did various chipmakers measure against each other last year?
We rank the biggest semiconductor companies by their percentage share of the industry’s revenues in 2023, using data from Omdia research.
Which Chip Company Made the Most Money in 2023?
Market leader and industry-defining veteran Intel still holds the crown for the most revenue in the sector, crossing $50 billion in 2023, or 10% of the broader industry’s topline.
All is not well at Intel, however, with the company’s stock price down over 20% year-to-date after it revealed billion-dollar losses in its foundry business.
| Rank | Company | 2023 Revenue | % of Industry Revenue |
|---|---|---|---|
| 1 | Intel | $51B | 9.4% |
| 2 | NVIDIA | $49B | 9.0% |
| 3 | Samsung Electronics | $44B | 8.1% |
| 4 | Qualcomm | $31B | 5.7% |
| 5 | Broadcom | $28B | 5.2% |
| 6 | SK Hynix | $24B | 4.4% |
| 7 | AMD | $22B | 4.1% |
| 8 | Apple | $19B | 3.4% |
| 9 | Infineon Tech | $17B | 3.2% |
| 10 | STMicroelectronics | $17B | 3.2% |
| 11 | Texas Instruments | $17B | 3.1% |
| 12 | Micron Technology | $16B | 2.9% |
| 13 | MediaTek | $14B | 2.6% |
| 14 | NXP | $13B | 2.4% |
| 15 | Analog Devices | $12B | 2.2% |
| 16 | Renesas Electronics Corporation | $11B | 1.9% |
| 17 | Sony Semiconductor Solutions Corporation | $10B | 1.9% |
| 18 | Microchip Technology | $8B | 1.5% |
| 19 | Onsemi | $8B | 1.4% |
| 20 | KIOXIA Corporation | $7B | 1.3% |
| N/A | Others | $126B | 23.2% |
| N/A | Total | $545B | 100% |
Note: Figures are rounded. Totals and percentages may not sum to 100.
Meanwhile, Nvidia is very close to overtaking Intel, after declaring $49 billion of topline revenue for 2023. This is more than double its 2022 revenue ($21 billion), increasing its share of industry revenues to 9%.
Nvidia’s meteoric rise has gotten a huge thumbs-up from investors. It became a trillion dollar stock last year, and broke the single-day gain record for market capitalization this year.
Other chipmakers haven’t been as successful. Out of the top 20 semiconductor companies by revenue, 12 did not match their 2022 revenues, including big names like Intel, Samsung, and AMD.
The Many Different Types of Chipmakers
All of these companies may belong to the same industry, but they don’t focus on the same niche.
According to Investopedia, there are four major types of chips, depending on their functionality: microprocessors, memory chips, standard chips, and complex systems on a chip.
Nvidia’s core business was once GPUs for computers (graphics processing units), but in recent years this has drastically shifted towards microprocessors for analytics and AI.
These specialized chips seem to be where the majority of growth is occurring within the sector. For example, companies that are largely in the memory segment—Samsung, SK Hynix, and Micron Technology—saw peak revenues in the mid-2010s.

-

 Real Estate2 weeks ago
Visualizing America’s Shortage of Affordable Homes
-

 Technology1 week ago
Ranked: Semiconductor Companies by Industry Revenue Share
-

 Money1 week ago
Which States Have the Highest Minimum Wage in America?
-

 Real Estate1 week ago
Ranked: The Most Valuable Housing Markets in America
-

 Business2 weeks ago
Charted: Big Four Market Share by S&P 500 Audits
-

 AI2 weeks ago
The Stock Performance of U.S. Chipmakers So Far in 2024
-

 Misc2 weeks ago
Almost Every EV Stock is Down After Q1 2024
-

 Money2 weeks ago
Where Does One U.S. Tax Dollar Go?