Demographics
How Media Consumption Evolved Throughout COVID-19
View the full-resolution version of this infographic
How Media Consumption Evolved Throughout COVID-19
View the full size version of this infographic by clicking here
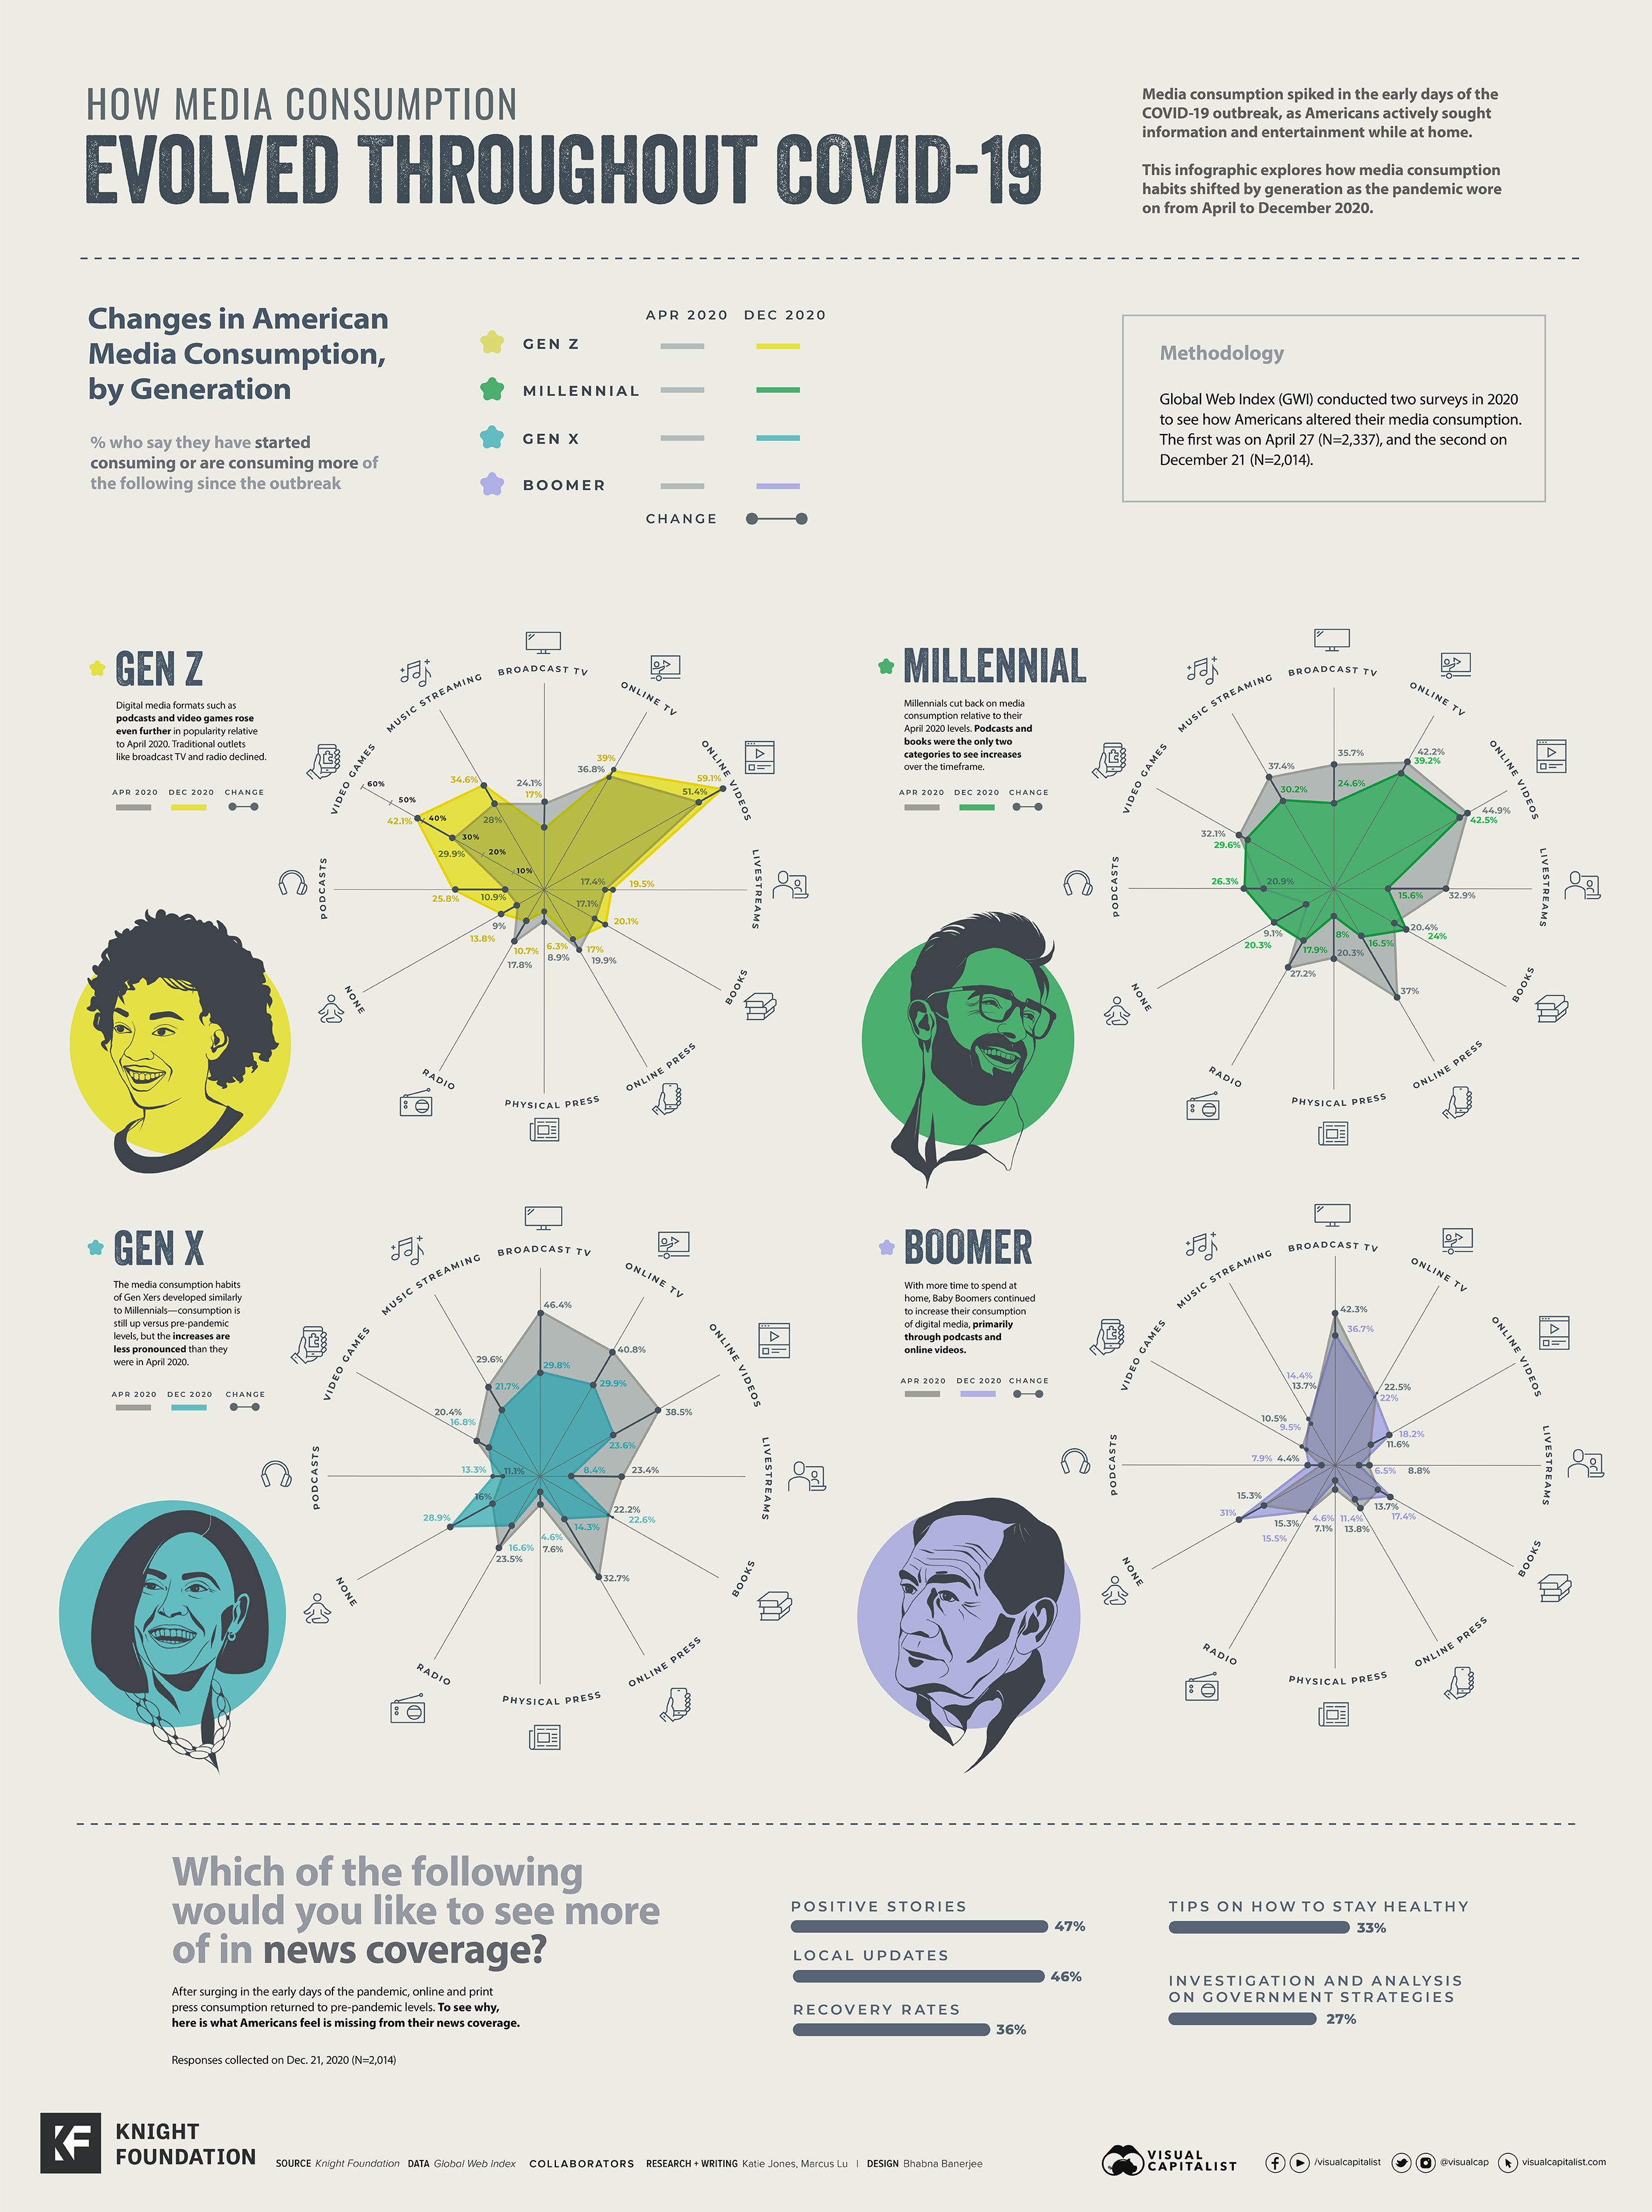
Media consumption spiked in the early days of the COVID-19 outbreak as Americans actively sought information and entertainment while at home. Whether this changed over the course of 2020 remains unclear, however.
To dive deeper into the issue, this infographic explores each generation’s shifts in media consumption habits as the pandemic wore on.
Further below, we’ll also examine which media sources Americans deemed to be the most trustworthy, and why consumption habits may have changed for good.
Changes in American Media Consumption, by Generation
The data in this infographic comes from two surveys conducted by Global Web Index (GWI). The first was completed in April 2020 (N=2,337) and asked participants a series of questions regarding media consumption during COVID-19.
To see how consumption had changed by the end of the year, the John S. and James L. Knight Foundation commissioned GWI to complete a follow-up survey in December 2020 (N=2,014). The following tables provide a summary of the results.
Gen Z
Unsurprisingly, a significant percentage of Gen Z reported an increase in digital media consumption in April 2020 in comparison to pre-pandemic habits. This bump was driven by higher use of online videos, video games, and online TV/streaming films.
By December 2020, these media categories became even more popular with this cohort. Most notably, podcasts saw the highest increase, jumping almost 15% by the end of the year.
| Category | April 2020 | December 2020 | Change (percentage points) |
|---|---|---|---|
| Podcasts | 10.9% | 25.8% | +14.9% |
| Video Games | 29.9% | 42.1% | +12.2% |
| Music Streaming | 28.0% | 34.6% | +6.6% |
| Broadcast TV | 24.1% | 17.0% | -7.1% |
| Online TV / streaming films | 36.8% | 39% | +2.2% |
| Online Videos (Youtube/TikTok/etc.) | 51.4% | 59.1% | +7.7% |
| Livestreams | 17.4% | 19.5% | +2.1% |
| Books / literature | 17.1% | 20.1% | +3.0% |
| Online Press | 19.9% | 17.0% | -2.9% |
| Physical Press | 8.9% | 6.3% | -2.6% |
| Radio | 17.8% | 10.7% | -7.1% |
| None | 9.0% | 13.8% | +4.8% |
The popularity of traditional outlets like broadcast TV and radio declined from their April 2020 highs, though they are still up relative to pre-pandemic levels for Gen Z survey respondents.
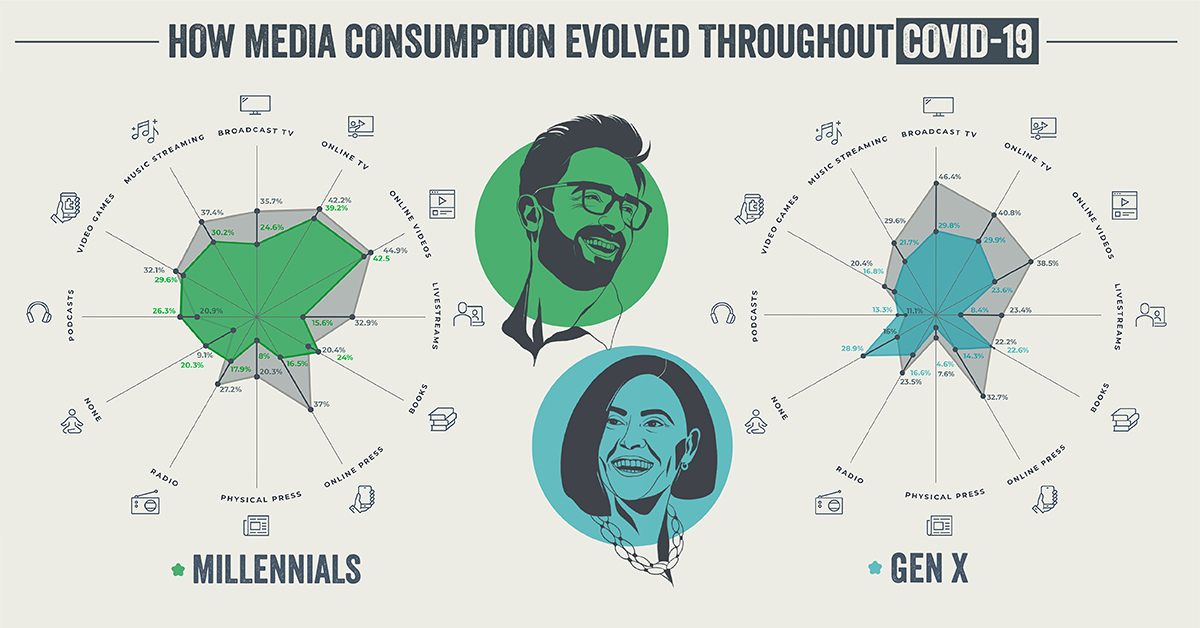
Millennials
Results from the December 2020 survey show that Millennials trimmed their media consumption from earlier in the year. This was most apparent in news outlets (online and physical press), which saw double digit declines in popularity relative to April.
| Category | April 2020 | December 2020 | Change (percentage points) |
|---|---|---|---|
| Podcasts | 20.9% | 26.3% | +5.4% |
| Video Games | 32.1% | 29.6% | -2.5% |
| Music Streaming | 37.4% | 30.2% | -7.2% |
| Broadcast TV | 35.7% | 24.6% | -11.1 |
| Online TV / streaming films | 42.2% | 39.2% | -3.0 |
| Online Videos (Youtube/TikTok/etc.) | 44.9% | 42.5% | -2.4% |
| Livestreams | 32.9% | 15.6% | -17.3% |
| Books / literature | 20.4% | 24% | +3.6% |
| Online Press | 37.0% | 16.5% | -20.5% |
| Physical Press | 20.3% | 8.0% | -12.3% |
| Radio | 27.2% | 17.9% | -9.3% |
| None | 9.1% | 20.3% | +11.2% |
Books and podcasts were the only two categories to capture more interest from Millennials over the time period. It’s also worth noting that the percentage of respondents who said “none” for media consumption rose to 20.3%, up significantly from 9.1% in April.
Possible factors for the increase in “none” responses include easing government restrictions and a return to more normal work schedules.
Gen X
The media consumption habits of Gen X developed similarly to Millennials over the year.
| Category | April 2020 | December 2020 | Change (percentage points) |
|---|---|---|---|
| Podcasts | 11.1% | 13.3% | +2.2% |
| Video Games | 20.4% | 16.8% | -3.6% |
| Music Streaming | 29.6% | 21.7% | -7.9% |
| Broadcast TV | 46.4% | 29.8% | -16.6% |
| Online TV / streaming films | 40.8% | 29.9% | -10.9% |
| Online Videos (Youtube/TikTok/etc.) | 38.5% | 23.6% | -14.9% |
| Livestreams | 23.4% | 8.4% | -15.0% |
| Books / literature | 22.2% | 22.6% | +0.4% |
| Online Press | 32.7% | 14.3% | -18.4% |
| Physical Press | 7.6% | 4.6% | -3.0% |
| Radio | 23.5% | 16.6% | -6.9% |
| None | 16.0% | 28.9% | +12.9% |
Broadcast TV and online press saw the largest declines over the time period, while once again, podcasts and books were the only two categories to capture more interest relative to April. The percentage of respondents reporting “none” rose to 28.9%—a slightly higher share than that of Millennials.
Boomers
Media consumption trends among Baby Boomers were mixed, with some categories increasing and others decreasing since April. Broadcast TV saw the biggest decline in usage of all media types, but remained the most popular category for this cohort.
| Category | April 2020 | December 2020 | Change (percentage points) |
|---|---|---|---|
| Podcasts | 4.4% | 7.9% | +3.5% |
| Video Games | 10.5% | 9.5% | -1.0% |
| Music Streaming | 13.7% | 14.4% | +0.7% |
| Broadcast TV | 42.3% | 36.7% | -5.6% |
| Online TV / streaming films | 22.5% | 22.0% | -0.5% |
| Online videos (Youtube/TikTok/etc.) | 11.6% | 18.2% | +6.6% |
| Livestreams | 8.8% | 6.5% | -2.3% |
| Books / literature | 13.7% | 17.4% | +3.7% |
| Online Press | 13.8% | 11.4% | -2.4% |
| Physical Press | 7.1% | 4.6% | -2.5% |
| Radio | 15.3% | 15.5% | +0.2% |
| None | 23.0% | 31.0% | +8.0% |
Boomers also had the largest share of “none” respondents in both studies (23.0% in April and 31.0% in December).
Where do Americans Go For Trustworthy News?
To learn more about American media consumption—particularly when it came to staying updated on the pandemic—survey respondents were asked to confirm which of the following sources they found trustworthy.
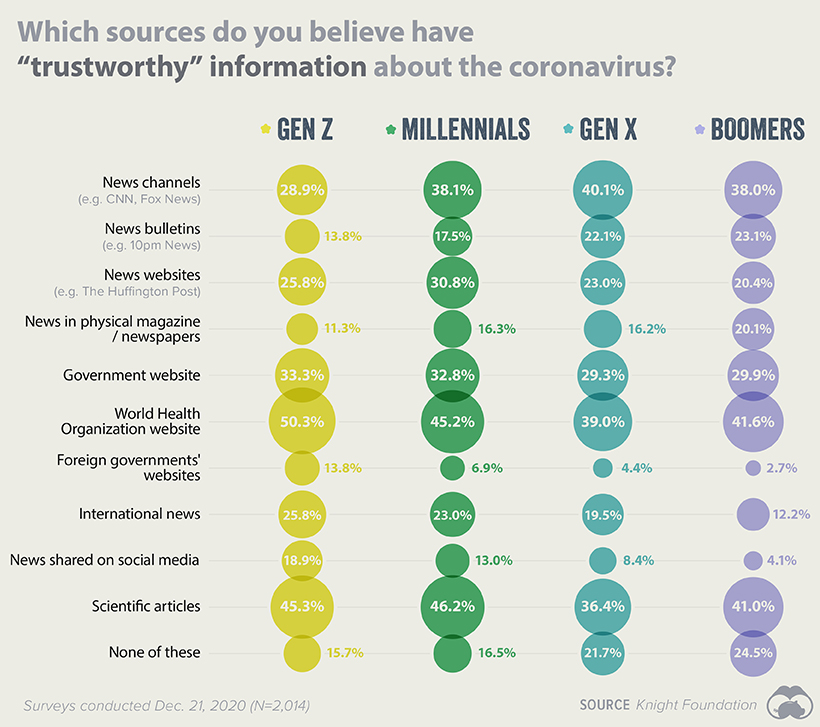
The deviations between each generation don’t appear to be too drastic, but there are some key takeaways from this data.
For starters, Gen Z appears to be more skeptical of mainstream news channels like CNN, with only 28.9% believing them to be trustworthy. This contrasts the most with Gen X, which saw 40.1% of its respondents give news channels the thumbs up.
This story is flipped when we turn to the World Health Organization (WHO). Gen Z demonstrated the highest levels of trust in information published by WHO, at 50.3% of respondents. Only 39.0% of Gen X could say the same.
By far the least trustworthy source was foreign governments’ websites. This category had the lowest average approval rating across the four generations, and scored especially poor with Boomers.
The Lasting Effects of the Pandemic
Habits that were picked up during 2020 are likely to linger, even as life finally returns to normal. To find out what’s changed, respondents were asked which categories of media they expected to continue consuming in elevated amounts.
The chart below shows each generation’s top three responses.
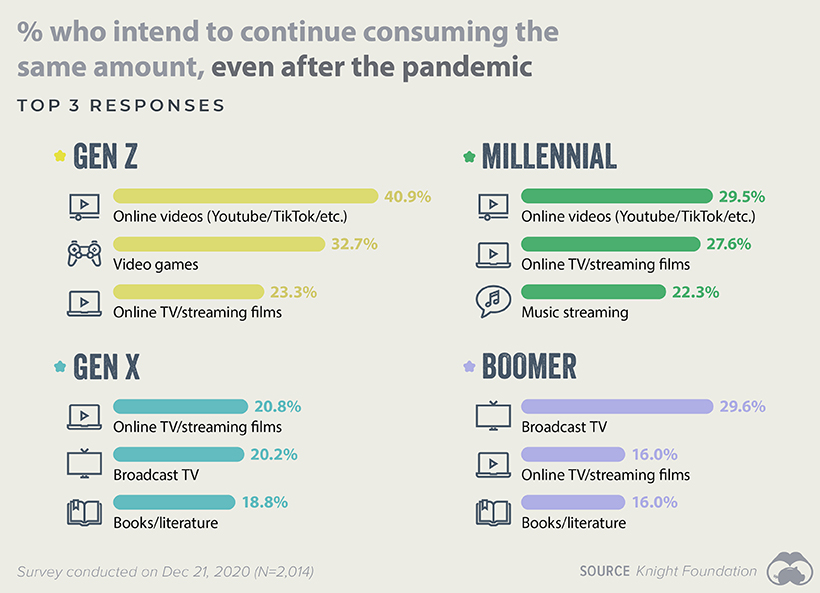
Note that the top three for both Gen Z and Millennials are all digital and online categories (video games can be played offline, but the majority of popular titles are online). This contrasts with the preferences of Gen X and Boomers, who appear to be sticking with more traditional outlets in broadcast TV and books.
With consumption habits of younger and older Americans moving in opposite directions, advertisers and media companies will likely need a clear understanding of their target audiences in order to be successful.


Demographics
The Countries That Have Become Sadder Since 2010
Tracking Gallup survey data for more than a decade reveals some countries are witnessing big happiness declines, reflecting their shifting socio-economic conditions.


The Countries That Have Become Sadder Since 2010
This was originally posted on our Voronoi app. Download the app for free on iOS or Android and discover incredible data-driven charts from a variety of trusted sources.
Can happiness be quantified?
Some approaches that try to answer this question make a distinction between two differing components of happiness: a daily experience part, and a more general life evaluation (which includes how people think about their life as a whole).
The World Happiness Report—first launched in 2012—has been making a serious go at quantifying happiness, by examining Gallup poll data that asks respondents in nearly every country to evaluate their life on a 0–10 scale. From this they extrapolate a single “happiness score” out of 10 to compare how happy (or unhappy) countries are.
More than a decade later, the 2024 World Happiness Report continues the mission. Its latest findings also include how some countries have become sadder in the intervening years.
Which Countries Have Become Unhappier Since 2010?
Afghanistan is the unhappiest country in the world right now, and is also 60% unhappier than over a decade ago, indicating how much life has worsened since 2010.
In 2021, the Taliban officially returned to power in Afghanistan, after nearly two decades of American occupation in the country. The Islamic fundamentalist group has made life harder, especially for women, who are restricted from pursuing higher education, travel, and work.
On a broader scale, the Afghan economy has suffered post-Taliban takeover, with various consequent effects: mass unemployment, a drop in income, malnutrition, and a crumbling healthcare system.
| Rank | Country | Happiness Score Loss (2010–24) | 2024 Happiness Score (out of 10) |
|---|---|---|---|
| 1 | 🇦🇫 Afghanistan | -2.6 | 1.7 |
| 2 | 🇱🇧 Lebanon | -2.3 | 2.7 |
| 3 | 🇯🇴 Jordan | -1.5 | 4.2 |
| 4 | 🇻🇪 Venezuela | -1.3 | 5.6 |
| 5 | 🇲🇼 Malawi | -1.2 | 3.4 |
| 6 | 🇿🇲 Zambia | -1.2 | 3.5 |
| 7 | 🇧🇼 Botswana | -1.2 | 3.4 |
| 8 | 🇾🇪 Yemen | -1.0 | 3.6 |
| 9 | 🇪🇬 Egypt | -1.0 | 4.0 |
| 10 | 🇮🇳 India | -0.9 | 4.1 |
| 11 | 🇧🇩 Bangladesh | -0.9 | 3.9 |
| 12 | 🇨🇩 DRC | -0.7 | 3.3 |
| 13 | 🇹🇳 Tunisia | -0.7 | 4.4 |
| 14 | 🇨🇦 Canada | -0.6 | 6.9 |
| 15 | 🇺🇸 U.S. | -0.6 | 6.7 |
| 16 | 🇨🇴 Colombia | -0.5 | 5.7 |
| 17 | 🇵🇦 Panama | -0.5 | 6.4 |
| 18 | 🇵🇰 Pakistan | -0.5 | 4.7 |
| 19 | 🇿🇼 Zimbabwe | -0.5 | 3.3 |
| 20 | 🇮🇪 Ireland | -0.5 | 6.8 |
| N/A | 🌍 World | +0.1 | 5.5 |
Nine countries in total saw their happiness score drop by a full point or more, on the 0–10 scale.
Noticeably, many of them have seen years of social and economic upheaval. Lebanon, for example, has been grappling with decades of corruption, and a severe liquidity crisis since 2019 that has resulted in a banking system collapse, sending poverty levels skyrocketing.
In Jordan, unprecedented population growth—from refugees leaving Iraq and Syria—has aggravated unemployment rates. A somewhat abrupt change in the line of succession has also raised concerns about political stability in the country.

-

 Maps1 week ago
The Largest Earthquakes in the New York Area (1970-2024)
-

 Money2 weeks ago
Where Does One U.S. Tax Dollar Go?
-

 Automotive2 weeks ago
Almost Every EV Stock is Down After Q1 2024
-

 AI2 weeks ago
The Stock Performance of U.S. Chipmakers So Far in 2024
-

 Markets2 weeks ago
Charted: Big Four Market Share by S&P 500 Audits
-

 Real Estate2 weeks ago
Ranked: The Most Valuable Housing Markets in America
-

 Money2 weeks ago
Which States Have the Highest Minimum Wage in America?
-

 AI2 weeks ago
Ranked: Semiconductor Companies by Industry Revenue Share