Technology
How Many Music Streams Does it Take to Earn a Dollar?
How Many Music Streams Does it Take to Earn a Dollar?
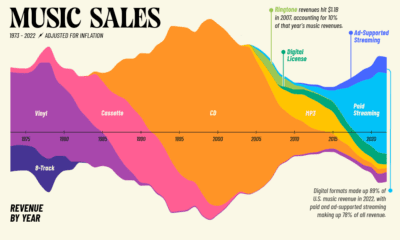
A decade ago, the music industry was headed for a protracted fade-out.
The disruptive effects of peer-to-peer file sharing had slashed music revenues in half, casting serious doubts over the future of the industry.
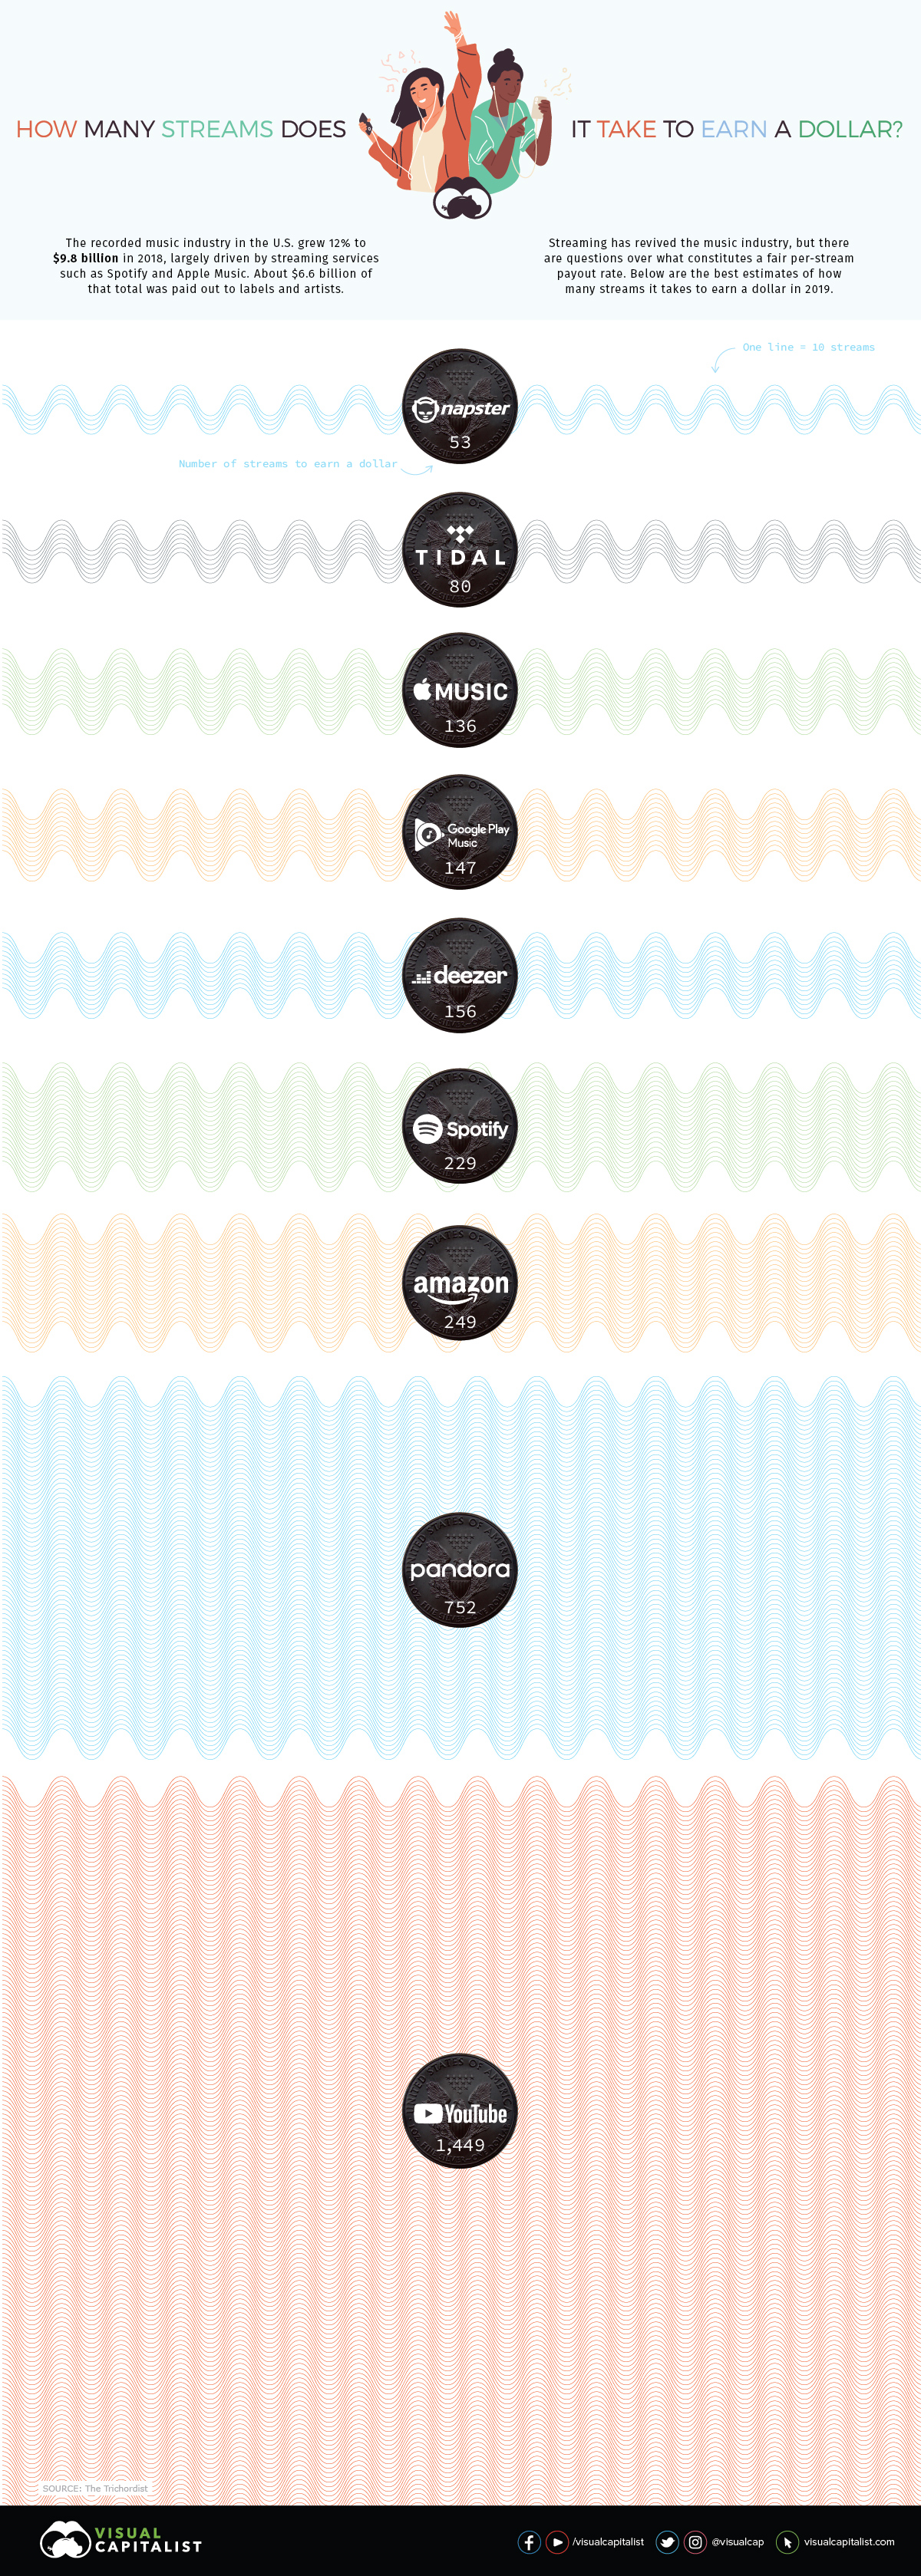
Ringtones provided a brief earnings bump, but it was the growing popularity of premium streaming services that proved to be the savior of record labels and artists. For the first time since the mid-90s, the music industry saw back-to-back years of growth, and revenues grew a brisk 12% in 2018 – nearly reaching $10 billion. In short, people showed they were still willing to pay for music.
Although most forecasts show streaming services like Spotify and Apple Music contributing an increasingly large share of revenue going forward, recent data from The Trichordist reveals that these services pay out wildly different rates per stream.
Note: Due to the lack of publicly available data, calculating payouts from streaming services is not an exact science. This data set is based on revenue from an indie label with a ~150 album catalogue generating over 115 million streams.
Full Stream Ahead
One would expect streaming services to have fairly similar payout rates every time a track is played, but this is not the case. In reality, the streaming rates of major players in the market – which have very similar catalogs – are all over the map. Below is a full breakdown of how many streams it takes to earn a dollar on various platforms:
| Streaming service | Avg. payout per stream | # of streams to earn one dollar | # of streams to earn minimum wage* |
|---|---|---|---|
| Napster | $0.019 | 53 | 77,474 |
| Tidal | $0.0125 | 80 | 117,760 |
| Apple Music | $0.00735 | 136 | 200,272 |
| Google Play Music | $0.00676 | 147 | 217,751 |
| Deezer | $0.0064 | 156 | 230,000 |
| Spotify | $0.00437 | 229 | 336,842 |
| Amazon | $0.00402 | 249 | 366,169 |
| Pandora** | $0.00133 | 752 | 1,106,767 |
| YouTube | $0.00069 | 1,449 | 2,133,333 |
*U.S. monthly minimum wage of $1,472 **Premium tier
Napster, once public enemy number one in the music business, has some of the most generous streaming rates in the industry. On the downside, the brand currently has a market share of less than 1%, so getting a high volume of plays on an album isn’t likely to happen for most artists.
On the flip side of the equation, YouTube has the highest number of plays per song, but the lowest payout per stream by far. It takes almost 1,500 plays to earn a single dollar on the Google-owned video platform.
Spotify, which is now the biggest player in the streaming market, is on the mid-to-low end of the compensation spectrum.
The Payment Pipeline
How do companies like Spotify calculate the amount paid out to license holders? Here’s a look at their payout process:
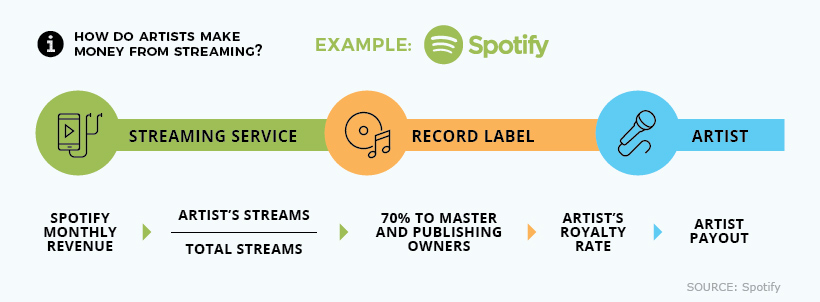
As this chart reveals, dollars earned from streaming still don’t tell the full story of how much artists receive at the end of the line. This amount is influenced by whether or not the performer has a record deal, and if other contributors have a stake in the recorded work.
The Pressure is Heating Up
When Spotify was a scrappy startup providing a much needed revenue stream to the music industry, labels were temporarily willing to accept lower streaming rates.
But now that Spotify is a public company, and tech giants like Apple and Amazon are in the picture, a growing chorus of industry players will likely dial up the pressure to increase compensation rates.


Technology
Ranked: Semiconductor Companies by Industry Revenue Share
Nvidia is coming for Intel’s crown. Samsung is losing ground. AI is transforming the space. We break down revenue for semiconductor companies.


Semiconductor Companies by Industry Revenue Share
This was originally posted on our Voronoi app. Download the app for free on Apple or Android and discover incredible data-driven charts from a variety of trusted sources.
Did you know that some computer chips are now retailing for the price of a new BMW?
As computers invade nearly every sphere of life, so too have the chips that power them, raising the revenues of the businesses dedicated to designing them.
But how did various chipmakers measure against each other last year?
We rank the biggest semiconductor companies by their percentage share of the industry’s revenues in 2023, using data from Omdia research.
Which Chip Company Made the Most Money in 2023?
Market leader and industry-defining veteran Intel still holds the crown for the most revenue in the sector, crossing $50 billion in 2023, or 10% of the broader industry’s topline.
All is not well at Intel, however, with the company’s stock price down over 20% year-to-date after it revealed billion-dollar losses in its foundry business.
| Rank | Company | 2023 Revenue | % of Industry Revenue |
|---|---|---|---|
| 1 | Intel | $51B | 9.4% |
| 2 | NVIDIA | $49B | 9.0% |
| 3 | Samsung Electronics | $44B | 8.1% |
| 4 | Qualcomm | $31B | 5.7% |
| 5 | Broadcom | $28B | 5.2% |
| 6 | SK Hynix | $24B | 4.4% |
| 7 | AMD | $22B | 4.1% |
| 8 | Apple | $19B | 3.4% |
| 9 | Infineon Tech | $17B | 3.2% |
| 10 | STMicroelectronics | $17B | 3.2% |
| 11 | Texas Instruments | $17B | 3.1% |
| 12 | Micron Technology | $16B | 2.9% |
| 13 | MediaTek | $14B | 2.6% |
| 14 | NXP | $13B | 2.4% |
| 15 | Analog Devices | $12B | 2.2% |
| 16 | Renesas Electronics Corporation | $11B | 1.9% |
| 17 | Sony Semiconductor Solutions Corporation | $10B | 1.9% |
| 18 | Microchip Technology | $8B | 1.5% |
| 19 | Onsemi | $8B | 1.4% |
| 20 | KIOXIA Corporation | $7B | 1.3% |
| N/A | Others | $126B | 23.2% |
| N/A | Total | $545B | 100% |
Note: Figures are rounded. Totals and percentages may not sum to 100.
Meanwhile, Nvidia is very close to overtaking Intel, after declaring $49 billion of topline revenue for 2023. This is more than double its 2022 revenue ($21 billion), increasing its share of industry revenues to 9%.
Nvidia’s meteoric rise has gotten a huge thumbs-up from investors. It became a trillion dollar stock last year, and broke the single-day gain record for market capitalization this year.
Other chipmakers haven’t been as successful. Out of the top 20 semiconductor companies by revenue, 12 did not match their 2022 revenues, including big names like Intel, Samsung, and AMD.
The Many Different Types of Chipmakers
All of these companies may belong to the same industry, but they don’t focus on the same niche.
According to Investopedia, there are four major types of chips, depending on their functionality: microprocessors, memory chips, standard chips, and complex systems on a chip.
Nvidia’s core business was once GPUs for computers (graphics processing units), but in recent years this has drastically shifted towards microprocessors for analytics and AI.
These specialized chips seem to be where the majority of growth is occurring within the sector. For example, companies that are largely in the memory segment—Samsung, SK Hynix, and Micron Technology—saw peak revenues in the mid-2010s.

-

 Real Estate2 weeks ago
Visualizing America’s Shortage of Affordable Homes
-

 Technology1 week ago
Ranked: Semiconductor Companies by Industry Revenue Share
-

 Money1 week ago
Which States Have the Highest Minimum Wage in America?
-

 Real Estate1 week ago
Ranked: The Most Valuable Housing Markets in America
-

 Business2 weeks ago
Charted: Big Four Market Share by S&P 500 Audits
-

 AI2 weeks ago
The Stock Performance of U.S. Chipmakers So Far in 2024
-

 Misc2 weeks ago
Almost Every EV Stock is Down After Q1 2024
-

 Money2 weeks ago
Where Does One U.S. Tax Dollar Go?