Misc
How the World’s Most Iconic Logos Evolve Over Time
For many of the world’s most iconic companies, the value of a brand is immeasurable.
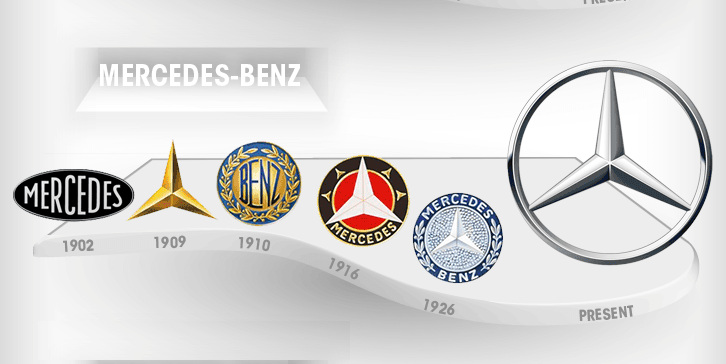
Companies like Apple or Mercedes-Benz work endlessly to forge identities that allow them to be instantly recognizable to consumers. They want a logo that communicates their mission, value proposition, history, and legacy – and to do this, many of these companies continue to use icons, symbols, or colors that are decades old.
But this doesn’t mean that their identities and logos are static. In fact, many of these world-class brands have actually changed dramatically, while still incorporating important elements from their company histories.
How Logos Evolve
This infographic comes to us from The Logo Company, and it is a compilation that shows how logos evolve over time:
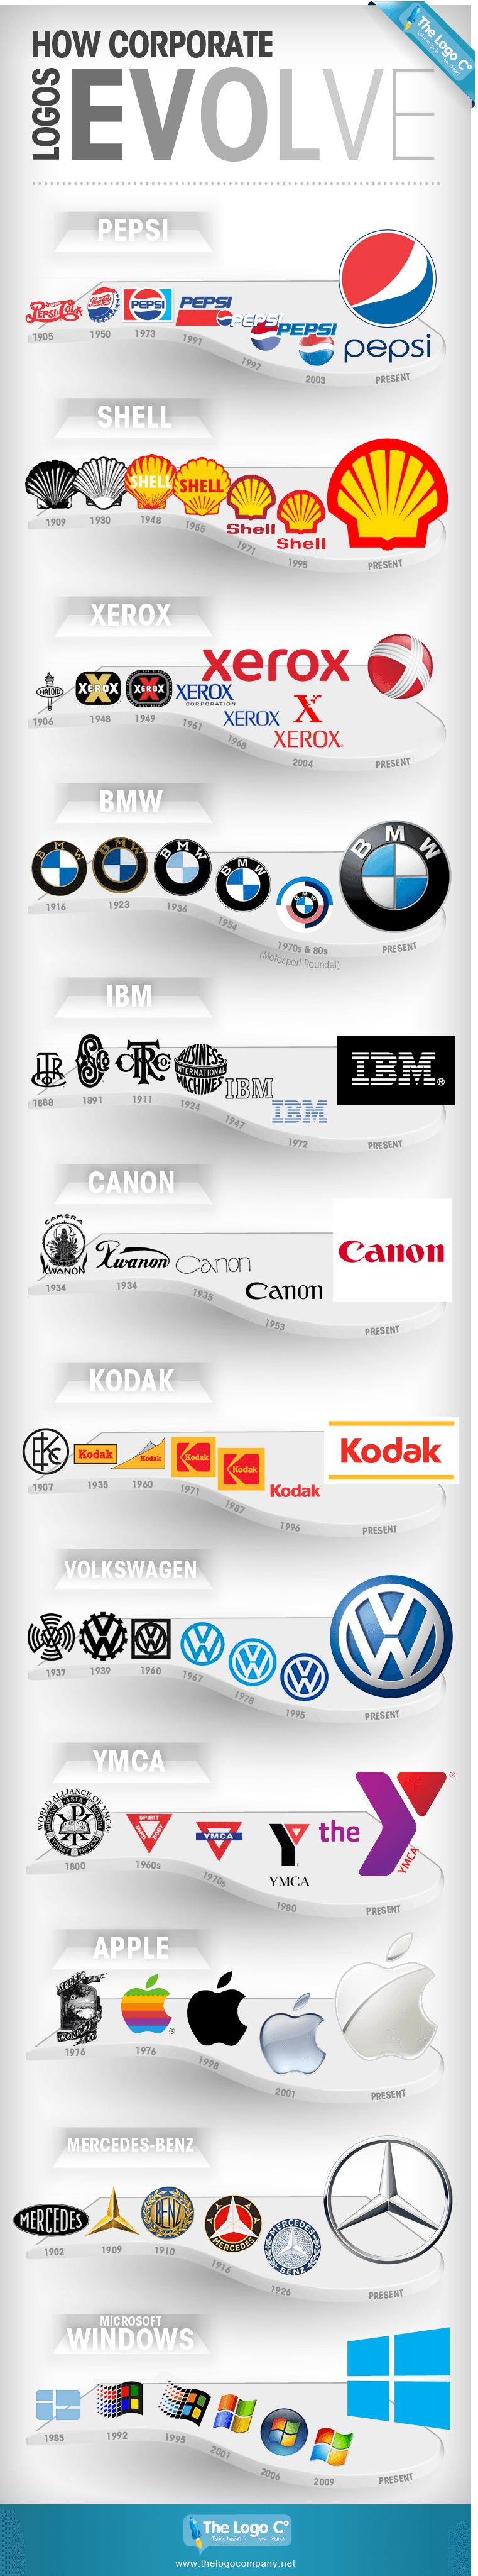
Even today, many of the world’s most iconic companies have logos that pay tribute to their rich histories. And though some of the imagery may stay the same, the logos continue to evolve to reflect the values and new design aesthetics of modernity.
For example, the identity of Royal Dutch Shell has been based around the image of a shell for well over a century. Between 1900 and 1930, the company represented itself by using realistic drawings of scallop and pecten shells:
![]()
The distinctive yellow and red colors were first added to service stations in 1915, and the shades eventually made it into the official logo itself by 1948. Today’s version of the Shell logo is ultra-simplified, and the brand is so recognizable that the logo often appears without the name of the company.
Pepsi’s brand history is another great example of how logos evolve while still paying tribute to company origins. The signature red, white, and blue combination comes from 1941, when the company changed the colors of its bottle cap to support America’s war effort. Since then, the Pepsi logo has used some mix of these colors, usually with a globe and swirl involved.
The most recent update to the logo in 2008 costed hundreds of millions of dollars, receiving heavy criticism from the design and business communities. However, for those that want to dive deeper, the rationale behind the redesign is quite interesting in itself.
![]()
Regardless, Pepsi’s brand has continued to evolve while maintaining at least some element of nostalgia from the company’s history. Whether it is effective or not is a story that will continue to be debated.


Misc
How Hard Is It to Get Into an Ivy League School?
We detail the admission rates and average annual cost for Ivy League schools, as well as the median SAT scores required to be accepted.


How Hard Is It to Get Into an Ivy League School?
This was originally posted on our Voronoi app. Download the app for free on iOS or Android and discover incredible data-driven charts from a variety of trusted sources.
Ivy League institutions are renowned worldwide for their academic excellence and long-standing traditions. But how hard is it to get into one of the top universities in the U.S.?
In this graphic, we detail the admission rates and average annual cost for Ivy League schools, as well as the median SAT scores required to be accepted. The data comes from the National Center for Education Statistics and was compiled by 24/7 Wall St.
Note that “average annual cost” represents the net price a student pays after subtracting the average value of grants and/or scholarships received.
Harvard is the Most Selective
The SAT is a standardized test commonly used for college admissions in the United States. It’s taken by high school juniors and seniors to assess their readiness for college-level academic work.
When comparing SAT scores, Harvard and Dartmouth are among the most challenging universities to gain admission to. The median SAT scores for their students are 760 for reading and writing and 790 for math. Still, Harvard has half the admission rate (3.2%) compared to Dartmouth (6.4%).
| School | Admission rate (%) | SAT Score: Reading & Writing | SAT Score: Math | Avg Annual Cost* |
|---|---|---|---|---|
| Harvard University | 3.2 | 760 | 790 | $13,259 |
| Columbia University | 3.9 | 750 | 780 | $12,836 |
| Yale University | 4.6 | 760 | 780 | $16,341 |
| Brown University | 5.1 | 760 | 780 | $26,308 |
| Princeton University | 5.7 | 760 | 780 | $11,080 |
| Dartmouth College | 6.4 | 760 | 790 | $33,023 |
| University of Pennsylvania | 6.5 | 750 | 790 | $14,851 |
| Cornell University | 7.5 | 750 | 780 | $29,011 |
*Costs after receiving federal financial aid.
Additionally, Dartmouth has the highest average annual cost at $33,000. Princeton has the lowest at $11,100.
While student debt has surged in the United States in recent years, hitting $1.73 trillion in 2023, the worth of obtaining a degree from any of the schools listed surpasses mere academics. This is evidenced by the substantial incomes earned by former students.
Harvard grads, for example, have the highest average starting salary in the country, at $91,700.

-

 Green2 weeks ago
Ranked: Top Countries by Total Forest Loss Since 2001
-

 Travel1 week ago
Ranked: The World’s Top Flight Routes, by Revenue
-

 Technology1 week ago
Ranked: Semiconductor Companies by Industry Revenue Share
-

 Money2 weeks ago
Which States Have the Highest Minimum Wage in America?
-

 Real Estate2 weeks ago
Ranked: The Most Valuable Housing Markets in America
-

 Markets2 weeks ago
Charted: Big Four Market Share by S&P 500 Audits
-

 AI2 weeks ago
The Stock Performance of U.S. Chipmakers So Far in 2024
-

 Automotive2 weeks ago
Almost Every EV Stock is Down After Q1 2024