Markets
How Every Asset Class, Currency, and S&P 500 Sector Performed in 2021
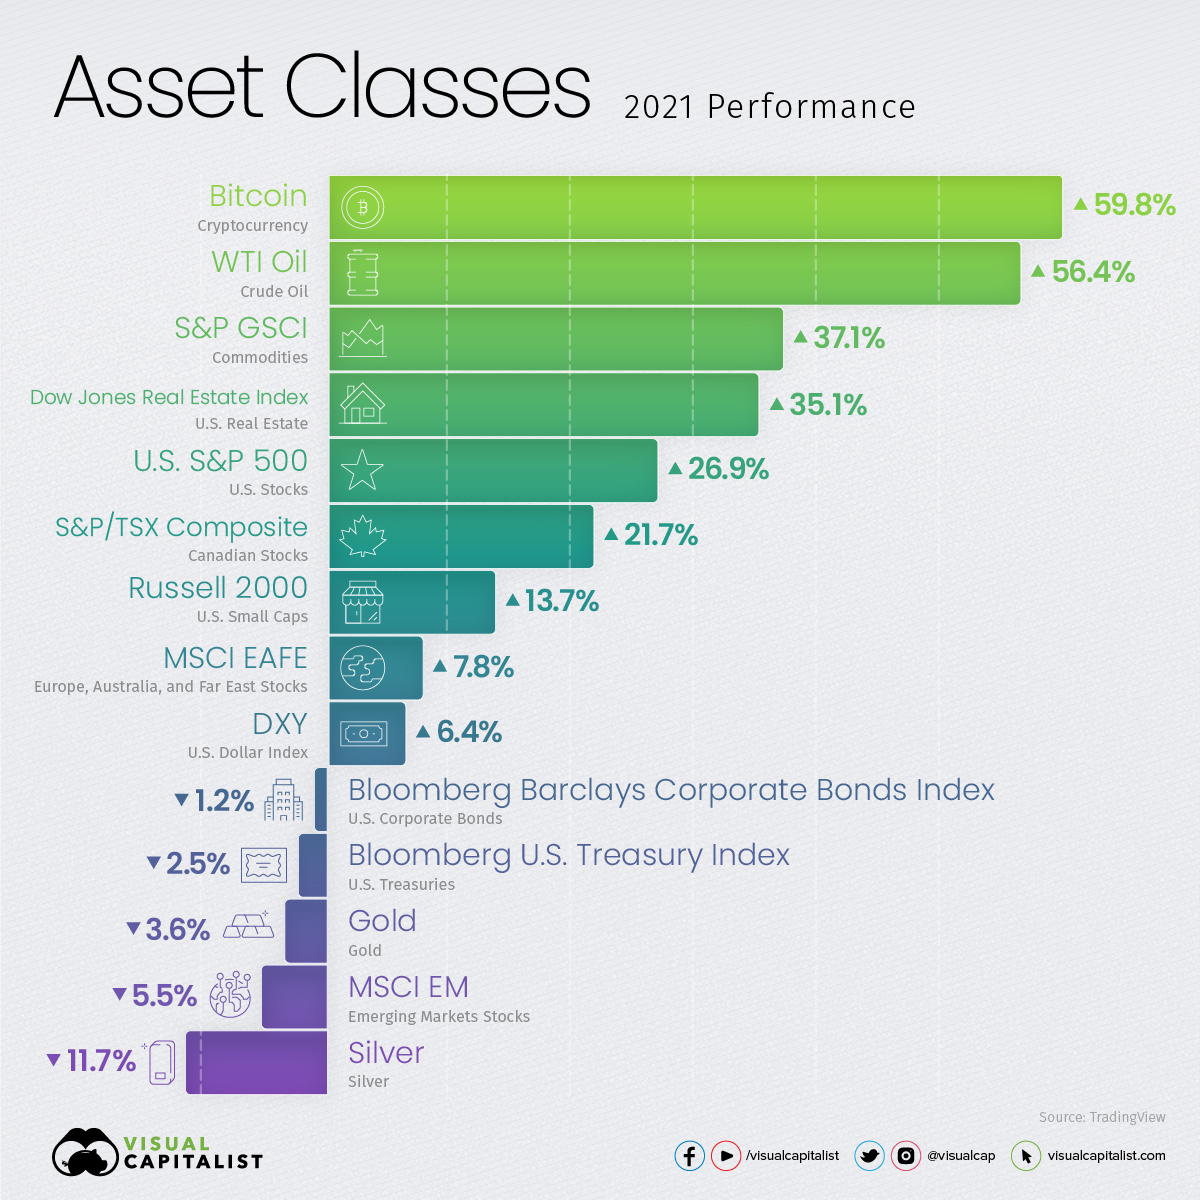
How Every Market Performed in 2021
After the roller coaster of volatility in 2020, the majority of asset classes in 2021 saw positive returns as the world reopened for business.
The Federal Reserve’s accommodative monetary policy, supply chain struggles, and high demand for fuels and raw materials for the clean energy transition largely shaped the markets.
Alongside the rise in inflation, commodities and cryptocurrency outperformed as broad equity indices saw double-digit returns, with the S&P 500 rising by 26.9% in 2021.
Markets Roundup for 2021
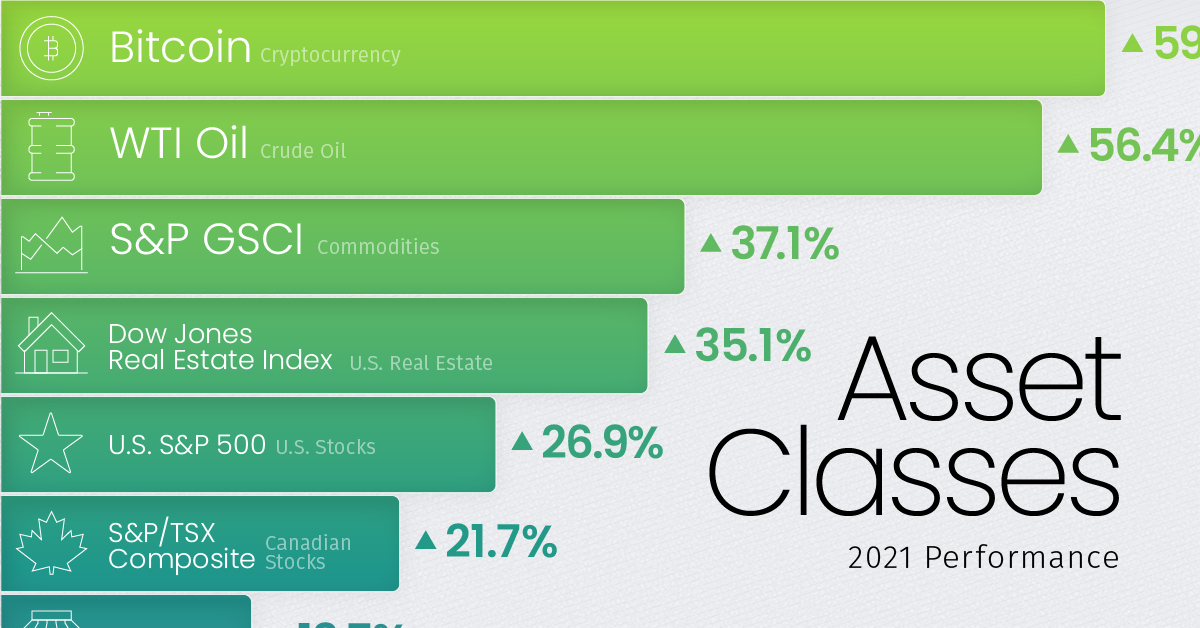
Speculation and the energy fuels for the world’s reopening were two of the main themes for markets in 2021, reflected in Bitcoin (59.8%) and crude oil (56.4%) being the top two performing assets in that time frame.
The S&P GSCI commodity index (37.1%) was another top performer, as agricultural and livestock food prices rose alongside the Dow Jones Real Estate Index (35.1%).
| Asset Class | 2021 Return | Asset Type |
|---|---|---|
| Bitcoin | 59.8% | Cryptocurrency |
| WTI Crude Oil | 56.4% | Commodity |
| S&P GSCI | 37.1% | Commodity |
| Dow Jones Real Estate Index | 35.1% | Real Estate |
| S&P 500 | 26.9% | Equities |
| S&P/TSX Composite | 21.7% | Equities |
| Russell 2000 | 13.7% | Equities |
| MSCI EAFE | 7.8% | Equities |
| U.S. Dollar | 6.4% | Currency |
| Bloomberg Barclays Corporate Bonds Index | -1.2% | Bonds |
| Bloomberg U.S. Treasury Index | -2.5% | Bonds |
| Gold | -3.6% | Commodity |
| MSCI Emerging Markets | -5.5% | Equities |
| Silver | -11.7% | Commodity |
Source: TradingView
Despite most physical and digital commodities seeing price gains, precious metals such as gold (-3.6%) and silver (-11.7%) struggled to hold onto their value, while industrial and battery metals like lithium (477.4%) and cobalt (207.7%) surged.
Large cap equity indices like the S&P 500 (26.9%) almost doubled the returns of small caps (Russell 2000, 13.7%), with emerging markets failing to keep up as they fell 5.5%.
How the S&P 500 Sectors Performed
After last year’s poor performance as the worst-performing S&P 500 sector, energy (47.7%) was 2021’s best performing sector alongside the rise in crude oil and other energy commodities.
Two other negative performers last year, real estate (42.5%) and financials (32.6%), also turned it around and were among the top performing sectors this year.
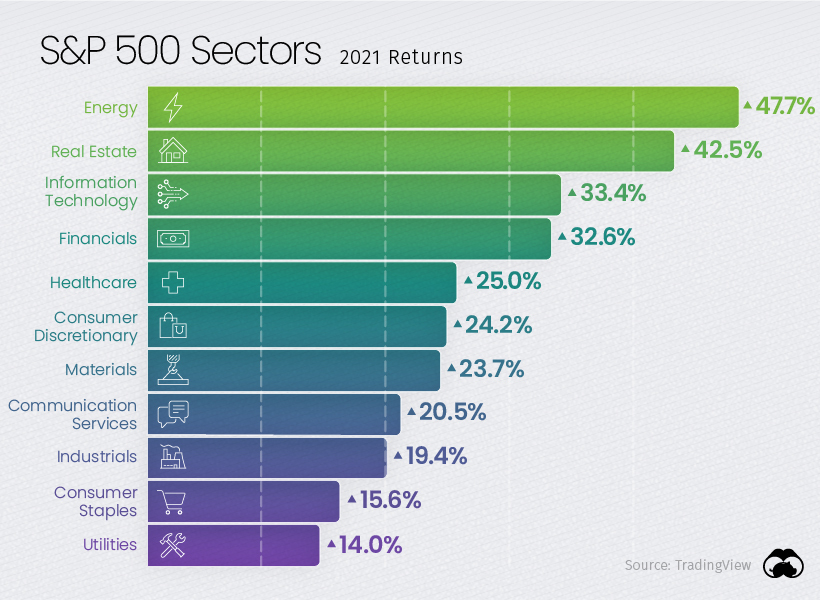
Despite many value equities performing well, growth equities still managed to keep a strong pace. Information technology (33.4%) continued to provide strong returns with Microsoft (51.2%) outperforming many of the other tech giants.
As Amazon (2.38%) and Netflix lagged behind (11.4%), Apple (33.8%) capped off its strong 2021 returns by becoming the first U.S. company to reach a $3T market cap at the start of 2022.
Foreign Exchange and Currency Returns in 2021
While the U.S. dollar struggled last year with most currencies outperforming it, 2021 saw the dollar index rise by 6.4%, outperforming most other currencies.
The Chinese yuan (2.7%) and Canadian dollar (0.7%) were the only major currencies that managed positive returns against the U.S. dollar, while the Australian dollar (-5.7%), Euro (-7.0%), and Japanese Yen (-10.2%) were among the worst performers.
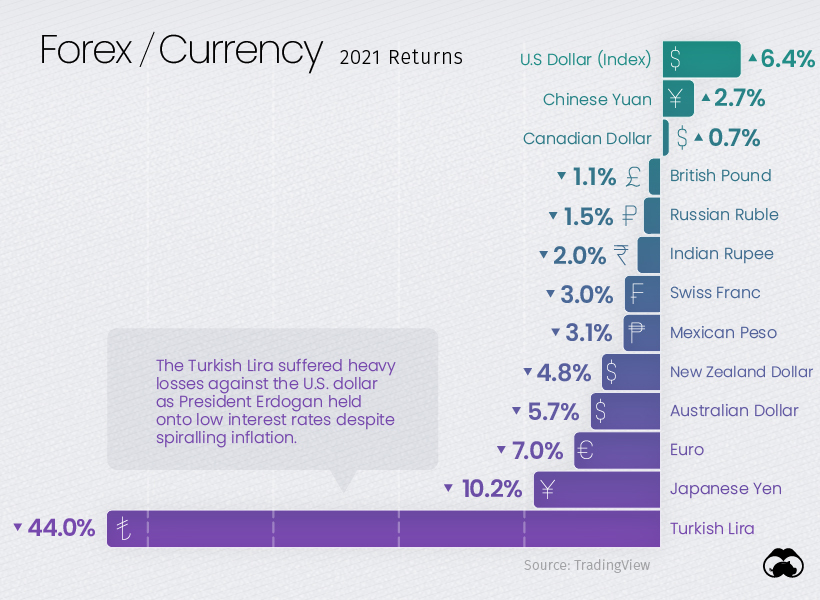
The Turkish lira was the standout loser in foreign exchange, and the turmoil was punctuated by turnover in the country’s finance minister position. While most other emerging economies raised interest rates to fight against inflation, Turkey has continued cutting rates and looks set to default on its $446 million of external debt.
The Winners and Losers of 2021
As the COVID-19 pandemic defined many of the winners and losers in 2020, the gradual reopening of international travel and business shaped the over and underperformers of 2021.
Cryptocurrencies had a standout year beyond Bitcoin (59.8%), which was greatly outpaced by many other cryptocurrencies and smart contract platforms like Ethereum (398.3%), Solana (11,177.8%), Avalanche (3,334.8%), and Luna (12,967.3%).
While Tesla (49.8%) had another strong year, Lucid and Ford Motors greatly outperformed Elon Musk’s company and the rest of the auto industry with their EV efforts. Demand was so great that Ford had to halt reservations for its F-150 Lightning pickup trucks at the end of 2021.
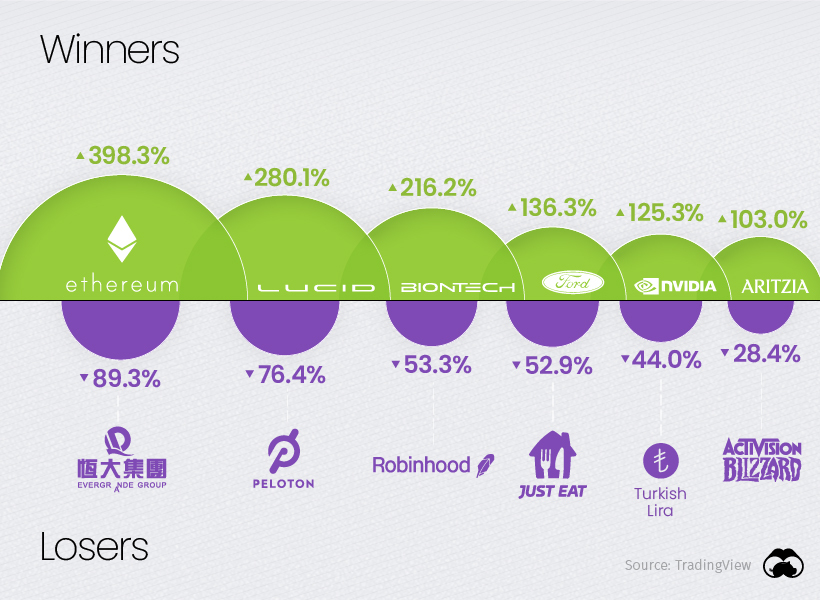
The pain of Evergrande Group (89.3%) shareholders is set to end soon, with the company starting 2022 by halting shares in Hong Kong as its $300 billion in liabilities remain in limbo.
Peloton (-76.4%) was another big loser in 2021 as it gave back nearly all of its gains from last year, proving lockdown speculation fueled most of its former valuation. Just Eat (-52.9%) was similarly hit hard as restaurants reopened in 2021.
Robinhood’s (53.3%) weak performance since its IPO puts a bow on 2021’s retail “stonk” frenzy kicked off by the Wall Street Bets subreddit.
With 2021 being a breakout year for retail traders and investors online, we’ll see if 2022 remains risk-on as the Fed begins tapering, or if markets are due for a change in direction.


Economy
Economic Growth Forecasts for G7 and BRICS Countries in 2024
The IMF has released its economic growth forecasts for 2024. How do the G7 and BRICS countries compare?


G7 & BRICS Real GDP Growth Forecasts for 2024
The International Monetary Fund’s (IMF) has released its real gross domestic product (GDP) growth forecasts for 2024, and while global growth is projected to stay steady at 3.2%, various major nations are seeing declining forecasts.
This chart visualizes the 2024 real GDP growth forecasts using data from the IMF’s 2024 World Economic Outlook for G7 and BRICS member nations along with Saudi Arabia, which is still considering an invitation to join the bloc.
Get the Key Insights of the IMF’s World Economic Outlook
Want a visual breakdown of the insights from the IMF’s 2024 World Economic Outlook report?
This visual is part of a special dispatch of the key takeaways exclusively for VC+ members.
Get the full dispatch of charts by signing up to VC+.
Mixed Economic Growth Prospects for Major Nations in 2024
Economic growth projections by the IMF for major nations are mixed, with the majority of G7 and BRICS countries forecasted to have slower growth in 2024 compared to 2023.
Only three BRICS-invited or member countries, Saudi Arabia, the UAE, and South Africa, have higher projected real GDP growth rates in 2024 than last year.
| Group | Country | Real GDP Growth (2023) | Real GDP Growth (2024P) |
|---|---|---|---|
| G7 | 🇺🇸 U.S. | 2.5% | 2.7% |
| G7 | 🇨🇦 Canada | 1.1% | 1.2% |
| G7 | 🇯🇵 Japan | 1.9% | 0.9% |
| G7 | 🇫🇷 France | 0.9% | 0.7% |
| G7 | 🇮🇹 Italy | 0.9% | 0.7% |
| G7 | 🇬🇧 UK | 0.1% | 0.5% |
| G7 | 🇩🇪 Germany | -0.3% | 0.2% |
| BRICS | 🇮🇳 India | 7.8% | 6.8% |
| BRICS | 🇨🇳 China | 5.2% | 4.6% |
| BRICS | 🇦🇪 UAE | 3.4% | 3.5% |
| BRICS | 🇮🇷 Iran | 4.7% | 3.3% |
| BRICS | 🇷🇺 Russia | 3.6% | 3.2% |
| BRICS | 🇪🇬 Egypt | 3.8% | 3.0% |
| BRICS-invited | 🇸🇦 Saudi Arabia | -0.8% | 2.6% |
| BRICS | 🇧🇷 Brazil | 2.9% | 2.2% |
| BRICS | 🇿🇦 South Africa | 0.6% | 0.9% |
| BRICS | 🇪🇹 Ethiopia | 7.2% | 6.2% |
| 🌍 World | 3.2% | 3.2% |
China and India are forecasted to maintain relatively high growth rates in 2024 at 4.6% and 6.8% respectively, but compared to the previous year, China is growing 0.6 percentage points slower while India is an entire percentage point slower.
On the other hand, four G7 nations are set to grow faster than last year, which includes Germany making its comeback from its negative real GDP growth of -0.3% in 2023.
Faster Growth for BRICS than G7 Nations
Despite mostly lower growth forecasts in 2024 compared to 2023, BRICS nations still have a significantly higher average growth forecast at 3.6% compared to the G7 average of 1%.
While the G7 countries’ combined GDP is around $15 trillion greater than the BRICS nations, with continued higher growth rates and the potential to add more members, BRICS looks likely to overtake the G7 in economic size within two decades.
BRICS Expansion Stutters Before October 2024 Summit
BRICS’ recent expansion has stuttered slightly, as Argentina’s newly-elected president Javier Milei declined its invitation and Saudi Arabia clarified that the country is still considering its invitation and has not joined BRICS yet.
Even with these initial growing pains, South Africa’s Foreign Minister Naledi Pandor told reporters in February that 34 different countries have submitted applications to join the growing BRICS bloc.
Any changes to the group are likely to be announced leading up to or at the 2024 BRICS summit which takes place October 22-24 in Kazan, Russia.
Get the Full Analysis of the IMF’s Outlook on VC+
This visual is part of an exclusive special dispatch for VC+ members which breaks down the key takeaways from the IMF’s 2024 World Economic Outlook.
For the full set of charts and analysis, sign up for VC+.

-

 Markets1 week ago
U.S. Debt Interest Payments Reach $1 Trillion
-

 Business2 weeks ago
Charted: Big Four Market Share by S&P 500 Audits
-

 Markets2 weeks ago
Ranked: The Most Valuable Housing Markets in America
-

 Money2 weeks ago
Which States Have the Highest Minimum Wage in America?
-

 AI2 weeks ago
Ranked: Semiconductor Companies by Industry Revenue Share
-

 Markets2 weeks ago
Ranked: The World’s Top Flight Routes, by Revenue
-

 Countries2 weeks ago
Population Projections: The World’s 6 Largest Countries in 2075
-

 Markets2 weeks ago
The Top 10 States by Real GDP Growth in 2023