Markets
How Every Asset Class, Currency, and Sector Performed in 2018
We’re only a few days into 2019, but it appears markets have picked up exactly where they left off.
There is growing uncertainty and volatility almost everywhere, and individual events are starting to become catalysts for sell-offs or rallies. Whether it’s Apple’s recent profit warning or Fed chair Jerome Powell saying that he is “listening closely” to the markets, investors are taking cues from current events to figure out where the herd is grazing.
It’s hard to say where markets will head in 2019 – but before we get into the nitty-gritty of a new year, it’s worth taking one final look back at 2018 to see how it impacted investors.
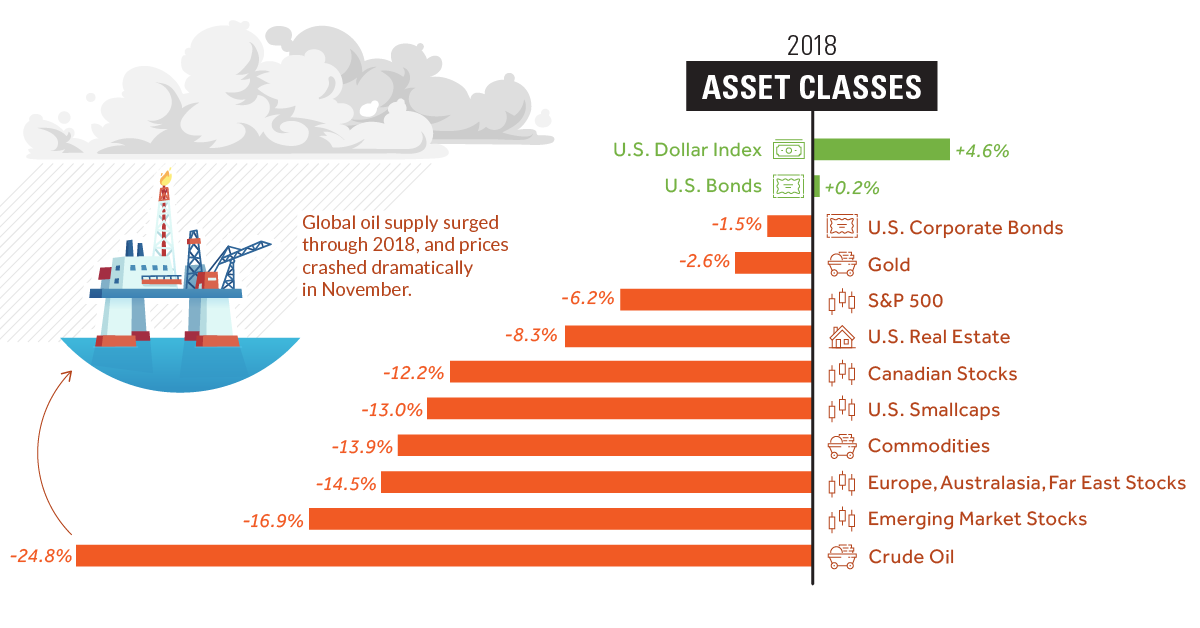
How Markets Did in 2018
We’ll start with broad asset classes, including stocks, bonds, commodities, and cash:
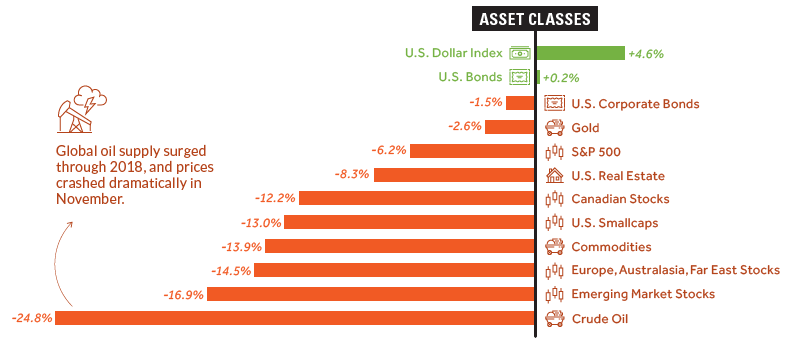
Note: Figures for equity markets are not including dividends
As you can see, it’s mostly a sea of red.
Cash turned out to be best option for the year, and several asset classes were crushed over the course of 2018, including crude oil and nearly all stocks. Despite this, large cap U.S. stocks (S&P 500) had no issues in outperforming equity alternatives, like smallcap stocks, foreign stocks, or emerging markets.
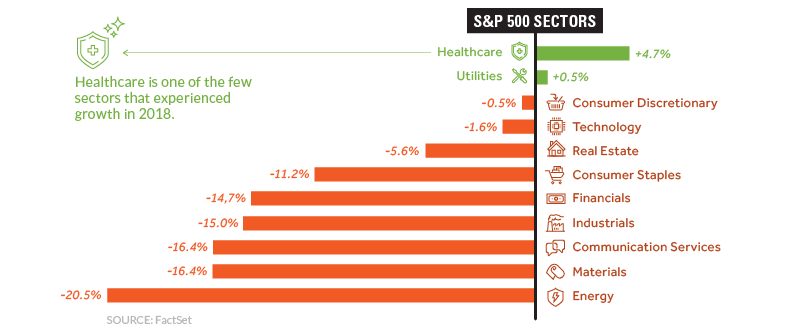
Breaking down the S&P 500 further into its sectors, it’s clear that nearly every industry struggled simultaneously.
Energy (-20.5%) and Materials (-16.4%) sectors were the hardest hit, and even the Technology sector eventually capitulated by the end of the year. Amazingly, Apple was considered a $1 trillion company in August, but today the tech giant’s market capitalization has already dropped down to a measly $700 billion.
The one exception to the general trend in S&P 500 stocks was Healthcare, which posted 4.7% returns over the course of 2018. Companies like Merck, Eli Lilly, and Pfizer all saw their stocks grow by double-digits, and it’s possible the sector could stay strong in 2019 as the world continues to age.
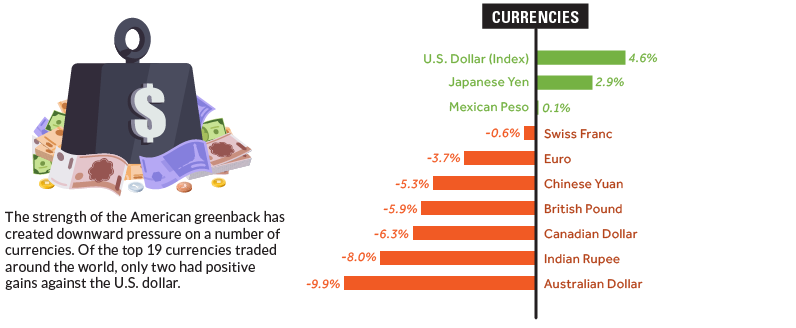
Lastly, here’s how major currency markets fared.
The U.S. dollar was the strongest major currency, and the Japanese yen had an impressive year as well. The Aussie dollar was routed, and now sits at 10-year lows.
Winners and Losers
Lastly, here’s an ad hoc list of some of the biggest winners and losers in 2018 – it includes some of the stocks and assets that saw notable gains or declines over the course of the year:
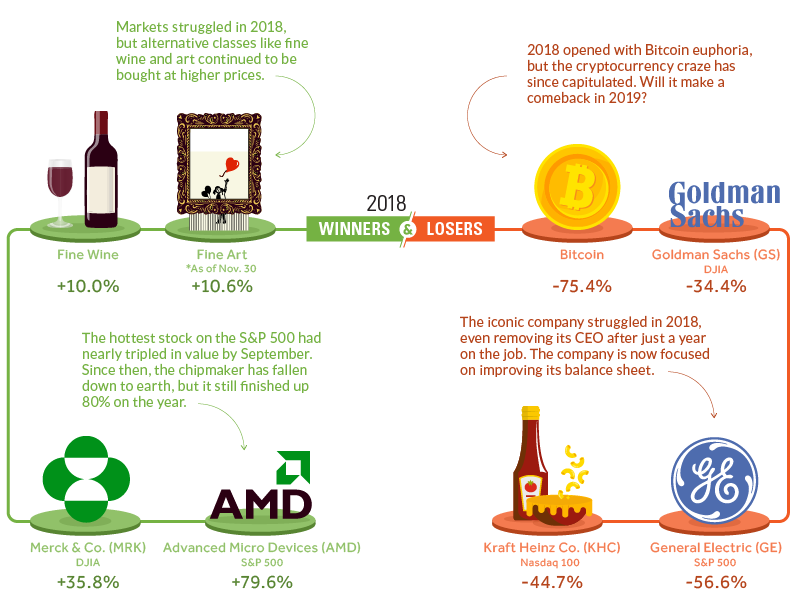
Interestingly, it was the finer things in life that outperformed most major asset classes. Both fine wine and fine art gained close to 10%, leaving most other indices behind in the dust.
AMD had a roller coaster year, finishing up nearly 80% as the biggest winner on the S&P 500. That said, owners of AMD stock may see things differently: the stock had actually tripled by September, and has fallen precipitously ever since.
Given the above recap, what are you investing in for 2019?


Markets
U.S. Debt Interest Payments Reach $1 Trillion
U.S. debt interest payments have surged past the $1 trillion dollar mark, amid high interest rates and an ever-expanding debt burden.


U.S. Debt Interest Payments Reach $1 Trillion
This was originally posted on our Voronoi app. Download the app for free on iOS or Android and discover incredible data-driven charts from a variety of trusted sources.
The cost of paying for America’s national debt crossed the $1 trillion dollar mark in 2023, driven by high interest rates and a record $34 trillion mountain of debt.
Over the last decade, U.S. debt interest payments have more than doubled amid vast government spending during the pandemic crisis. As debt payments continue to soar, the Congressional Budget Office (CBO) reported that debt servicing costs surpassed defense spending for the first time ever this year.
This graphic shows the sharp rise in U.S. debt payments, based on data from the Federal Reserve.
A $1 Trillion Interest Bill, and Growing
Below, we show how U.S. debt interest payments have risen at a faster pace than at another time in modern history:
| Date | Interest Payments | U.S. National Debt |
|---|---|---|
| 2023 | $1.0T | $34.0T |
| 2022 | $830B | $31.4T |
| 2021 | $612B | $29.6T |
| 2020 | $518B | $27.7T |
| 2019 | $564B | $23.2T |
| 2018 | $571B | $22.0T |
| 2017 | $493B | $20.5T |
| 2016 | $460B | $20.0T |
| 2015 | $435B | $18.9T |
| 2014 | $442B | $18.1T |
| 2013 | $425B | $17.2T |
| 2012 | $417B | $16.4T |
| 2011 | $433B | $15.2T |
| 2010 | $400B | $14.0T |
| 2009 | $354B | $12.3T |
| 2008 | $380B | $10.7T |
| 2007 | $414B | $9.2T |
| 2006 | $387B | $8.7T |
| 2005 | $355B | $8.2T |
| 2004 | $318B | $7.6T |
| 2003 | $294B | $7.0T |
| 2002 | $298B | $6.4T |
| 2001 | $318B | $5.9T |
| 2000 | $353B | $5.7T |
| 1999 | $353B | $5.8T |
| 1998 | $360B | $5.6T |
| 1997 | $368B | $5.5T |
| 1996 | $362B | $5.3T |
| 1995 | $357B | $5.0T |
| 1994 | $334B | $4.8T |
| 1993 | $311B | $4.5T |
| 1992 | $306B | $4.2T |
| 1991 | $308B | $3.8T |
| 1990 | $298B | $3.4T |
| 1989 | $275B | $3.0T |
| 1988 | $254B | $2.7T |
| 1987 | $240B | $2.4T |
| 1986 | $225B | $2.2T |
| 1985 | $219B | $1.9T |
| 1984 | $205B | $1.7T |
| 1983 | $176B | $1.4T |
| 1982 | $157B | $1.2T |
| 1981 | $142B | $1.0T |
| 1980 | $113B | $930.2B |
| 1979 | $96B | $845.1B |
| 1978 | $84B | $789.2B |
| 1977 | $69B | $718.9B |
| 1976 | $61B | $653.5B |
| 1975 | $55B | $576.6B |
| 1974 | $50B | $492.7B |
| 1973 | $45B | $469.1B |
| 1972 | $39B | $448.5B |
| 1971 | $36B | $424.1B |
| 1970 | $35B | $389.2B |
| 1969 | $30B | $368.2B |
| 1968 | $25B | $358.0B |
| 1967 | $23B | $344.7B |
| 1966 | $21B | $329.3B |
Interest payments represent seasonally adjusted annual rate at the end of Q4.
At current rates, the U.S. national debt is growing by a remarkable $1 trillion about every 100 days, equal to roughly $3.6 trillion per year.
As the national debt has ballooned, debt payments even exceeded Medicaid outlays in 2023—one of the government’s largest expenditures. On average, the U.S. spent more than $2 billion per day on interest costs last year. Going further, the U.S. government is projected to spend a historic $12.4 trillion on interest payments over the next decade, averaging about $37,100 per American.
Exacerbating matters is that the U.S. is running a steep deficit, which stood at $1.1 trillion for the first six months of fiscal 2024. This has accelerated due to the 43% increase in debt servicing costs along with a $31 billion dollar increase in defense spending from a year earlier. Additionally, a $30 billion increase in funding for the Federal Deposit Insurance Corporation in light of the regional banking crisis last year was a major contributor to the deficit increase.
Overall, the CBO forecasts that roughly 75% of the federal deficit’s increase will be due to interest costs by 2034.

-

 Green2 weeks ago
Ranked: Top Countries by Total Forest Loss Since 2001
-

 Travel1 week ago
Ranked: The World’s Top Flight Routes, by Revenue
-

 Technology1 week ago
Ranked: Semiconductor Companies by Industry Revenue Share
-

 Money2 weeks ago
Which States Have the Highest Minimum Wage in America?
-

 Real Estate2 weeks ago
Ranked: The Most Valuable Housing Markets in America
-

 Markets2 weeks ago
Charted: Big Four Market Share by S&P 500 Audits
-

 AI2 weeks ago
The Stock Performance of U.S. Chipmakers So Far in 2024
-

 Misc2 weeks ago
Almost Every EV Stock is Down After Q1 2024