Money
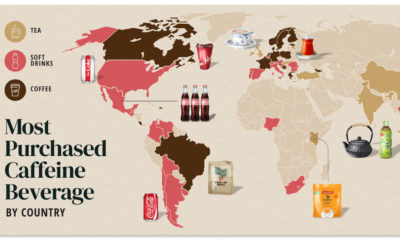
How Do People in Different Countries Spend Their Money?
How Do People in Different Countries Spend Their Money?
Have you ever wondered how much money Russians spend on alcohol and tobacco compared to the rest of the world? Or how much households in Saudi Arabia allocate to recreation?
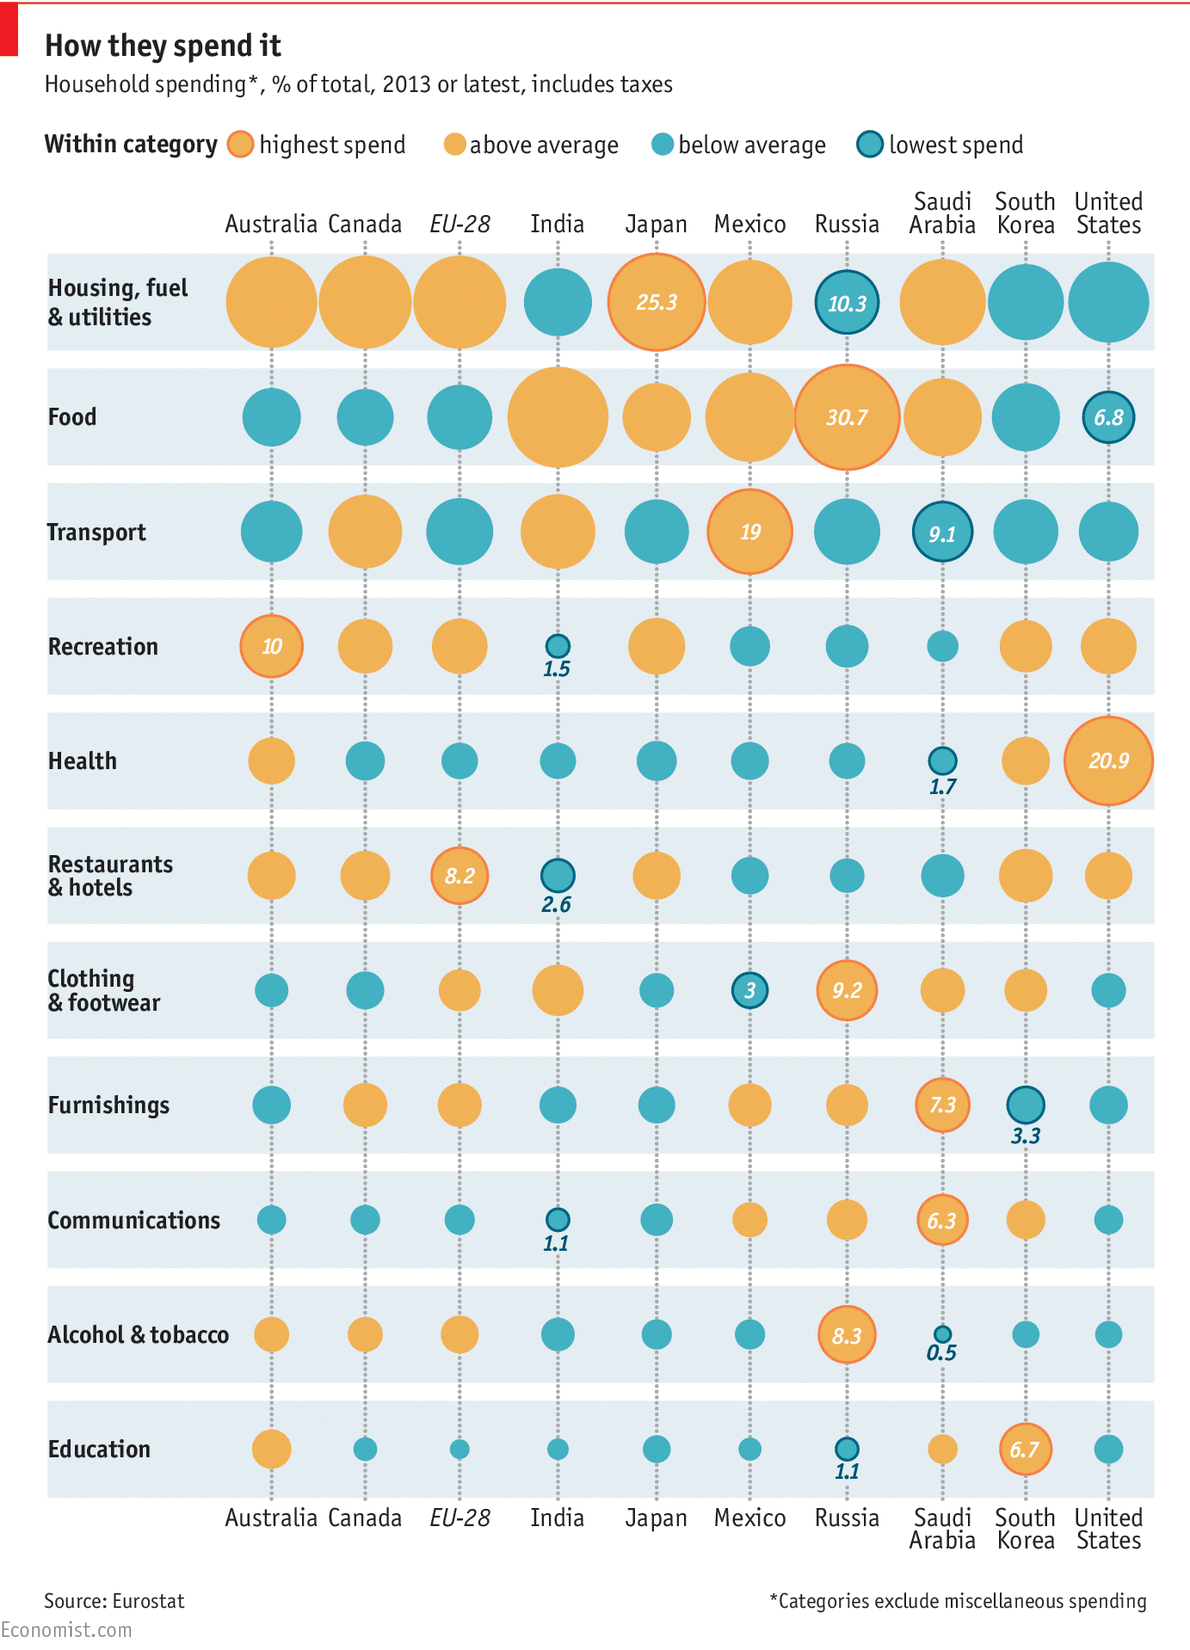
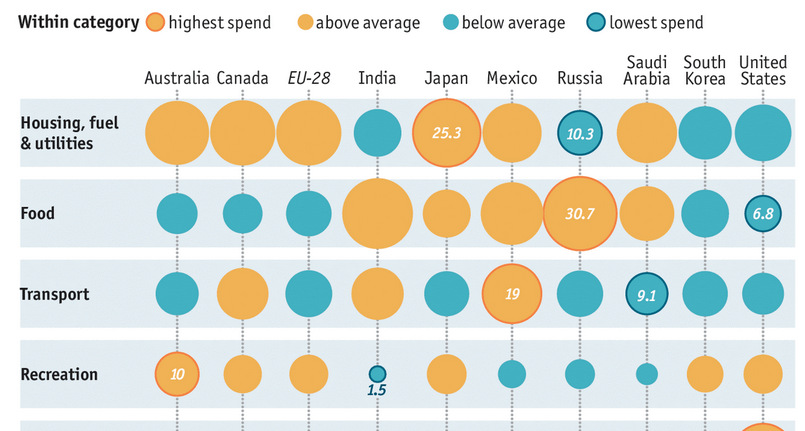
Today’s data visualization from The Economist shows how much people in households around the world allocate to different expenses such as food, housing, recreation, transportation, and education.
The first thing to note is that this looks at private spending only, and does not include any public spending that could be allocated to each household. As a result, in places like Canada or the EU, spending on healthcare is much smaller than in comparison to the United States, where households spend 20.9% of their money.
Here’s a few interesting stats:
In Russia, where housing is subsidized, people spend way less on housing, fuel, and utilities with only 10.3% of money allocated. At the same time, they are the biggest relative spenders on food, alcohol and tobacco, and clothing.
Developed countries are more or less the opposite of Russia in this regard. In places like the United States, Canada, Japan, or the EU, about 20-25% of money is spend on housing, fuel, and utilities. Meanwhile, consumption of food, alcohol and tobacco, and clothing are on the lower ends of the spectrum. In fact, its actually the United States that spends the smallest portion on food altogether, at only 6.8%.
Contrast that to India, where GDP per capita is by far the lowest at only US$1498.87. With little disposable income, Indians spend a much higher proportion of money on necessities such as food (about 30%), while using much less income on things like recreation (1.5%) or restaurants and hotels (2.6%).


Money
Charted: Who Has Savings in This Economy?
Older, better-educated adults are winning the savings game, reveals a January survey by the National Opinion Research Center at the University of Chicago.


Who Has Savings in This Economy?
This was originally posted on our Voronoi app. Download the app for free on iOS or Android and discover incredible data-driven charts from a variety of trusted sources.
Two full years of inflation have taken their toll on American households. In 2023, the country’s collective credit card debt crossed $1 trillion for the first time. So who is managing to save money in the current economic environment?
We visualize the percentage of respondents to the statement “I have money leftover at the end of the month” categorized by age and education qualifications. Data is sourced from a National Endowment for Financial Education (NEFE) report, published last month.
The survey for NEFE was conducted from January 12-14, 2024, by the National Opinion Research Center at the University of Chicago. It involved 1,222 adults aged 18+ and aimed to be representative of the U.S. population.
Older Americans Save More Than Their Younger Counterparts
General trends from this dataset indicate that as respondents get older, a higher percentage of them are able to save.
| Age | Always/Often | Sometimes | Rarely/Never |
|---|---|---|---|
| 18–29 | 29% | 33% | 38% |
| 30–44 | 36% | 27% | 37% |
| 45–59 | 39% | 23% | 38% |
| Above 60 | 49% | 28% | 23% |
| All Adults | 39% | 33% | 27% |
Note: Percentages are rounded and may not sum to 100.
Perhaps not surprisingly, those aged 60+ are the age group with the highest percentage saying they have leftover money at the end of the month. This age group spent the most time making peak earnings in their careers, are more likely to have investments, and are more likely to have paid off major expenses like a mortgage or raising a family.
The Impact of Higher Education on Earnings and Savings
Based on this survey, higher education dramatically improves one’s ability to save. Shown in the table below, those with a bachelor’s degree or higher are three times more likely to have leftover money than those without a high school diploma.
| Education | Always/Often | Sometimes | Rarely/Never |
|---|---|---|---|
| No HS Diploma | 18% | 26% | 56% |
| HS Diploma | 28% | 33% | 39% |
| Associate Degree | 33% | 31% | 36% |
| Bachelor/Higher Degree | 59% | 21% | 20% |
| All Adults | 39% | 33% | 27% |
Note: Percentages are rounded and may not sum to 100.
As the Bureau of Labor Statistics notes, earnings improve with every level of education completed.
For example, those with a high school diploma made 25% more than those without in 2022. And as the qualifications increase, the effects keep stacking.
Meanwhile, a Federal Reserve study also found that those with more education tended to make financial decisions that contributed to building wealth, of which the first step is to save.

-

 Markets1 week ago
U.S. Debt Interest Payments Reach $1 Trillion
-

 Business2 weeks ago
Charted: Big Four Market Share by S&P 500 Audits
-

 Real Estate2 weeks ago
Ranked: The Most Valuable Housing Markets in America
-

 Money2 weeks ago
Which States Have the Highest Minimum Wage in America?
-

 AI2 weeks ago
Ranked: Semiconductor Companies by Industry Revenue Share
-

 Markets2 weeks ago
Ranked: The World’s Top Flight Routes, by Revenue
-

 Demographics2 weeks ago
Population Projections: The World’s 6 Largest Countries in 2075
-

 Markets2 weeks ago
The Top 10 States by Real GDP Growth in 2023