Technology
How Big Tech Makes Their Billions
Check out the 2022 edition of how Big Tech makes their billions for the latest update.
How Big Tech Makes Their Billions
Check out the 2022 edition of how Big Tech makes their billions for the latest update.
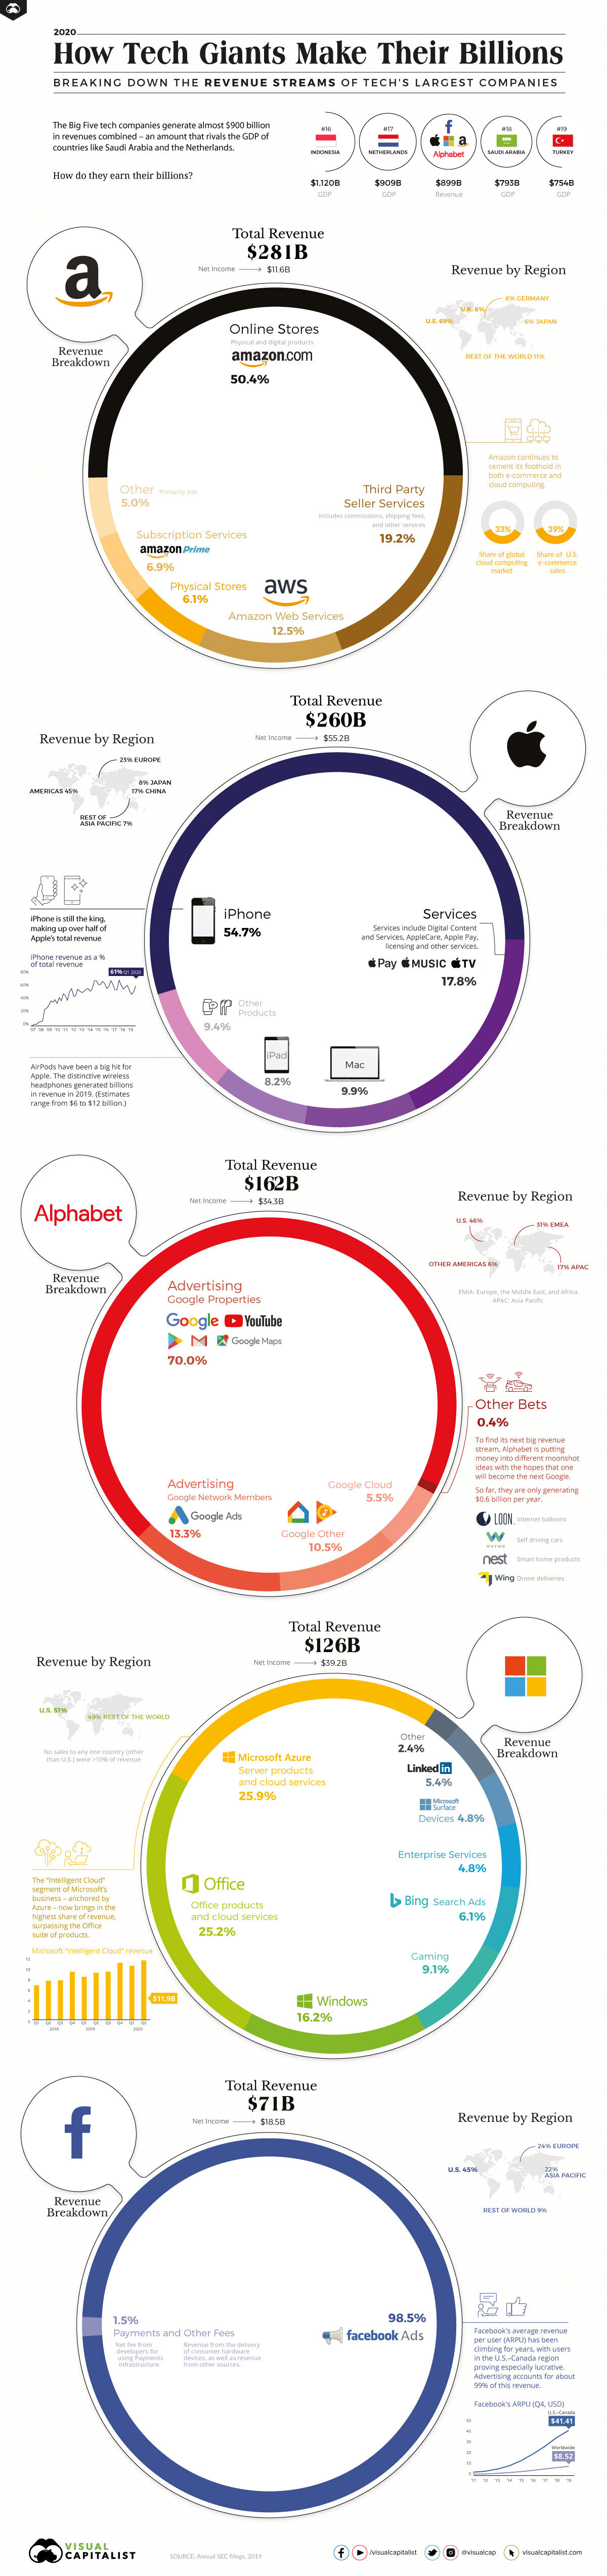
The world’s largest companies are all in technology, and four out of five of those “Big Tech” companies have grown to trillion-dollar market capitalizations.
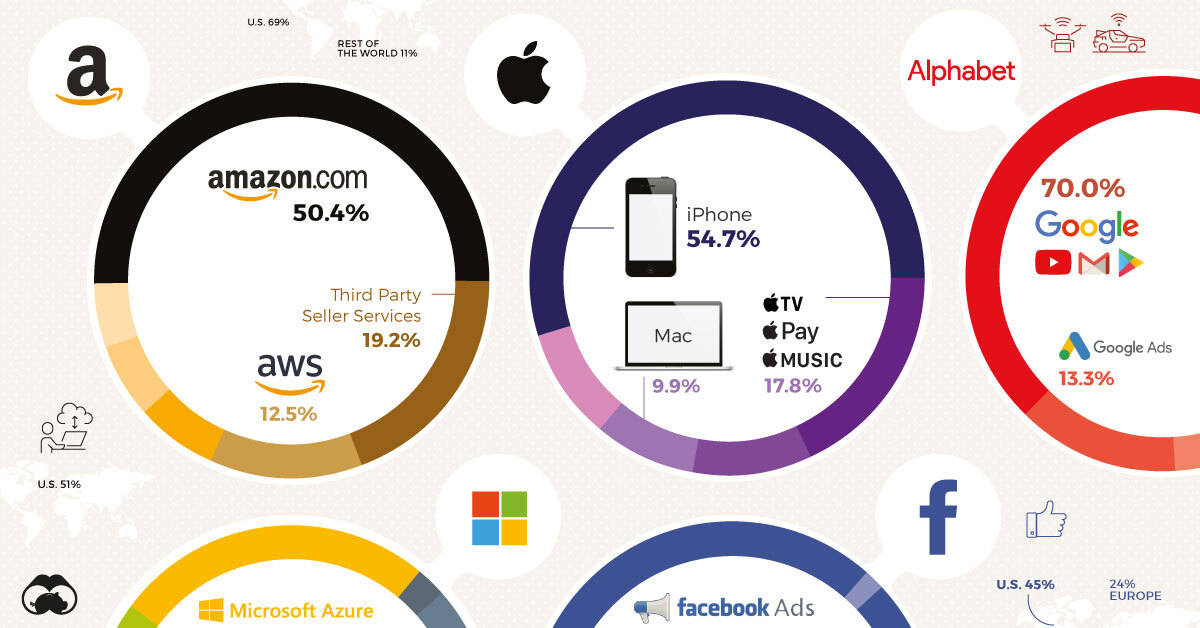
Despite their similarities, each of the five technology companies (Amazon, Apple, Facebook, Microsoft, and Alphabet) have very different cashflow breakdowns and growth trajectories. Some have a diversified mix of applications and cloud services, products, and data accumulation, while others have a more singular focus.
But through growth in almost all segments, Big Tech has eclipsed Big Oil and other major industry groups to comprise the most valuable publicly-traded companies in the world. By continuing to grow, these companies have strengthened the financial position of their billionaire founders and led the tech-heavy NASDAQ to new record highs.
Unfortunately, with growth comes difficulty. Data-use, diversity, and treatment of workers have all become hot-button issues on a global scale, putting Big Tech on the defensive with advertisers and governments alike.
Still, even this hasn’t stopped the tech giants from (almost) all posting massive revenue growth.
Revenues for Big Tech Keep Increasing
Across the board, greater technological adoption is the biggest driver of increased revenues.
Amazon earned the most in total revenue compared with last year’s figures, with leaps in almost all of the company’s operations. Revenue from online sales and third-party seller services increased by almost $30 billion, while Amazon Web Services and Amazon Prime saw increased revenues of $15 billion combined.
The only chunk of the Amazon pie that didn’t increase were physical store sales, which have stagnated after previously being the fastest growing segment.
Big Tech Revenues (2019 vs. 2018)
| Company | Revenue (2018) | Revenue (2019) | Growth (YoY) |
|---|---|---|---|
| Apple | $265.6 billion | $260.2 billion | -2.03% |
| Amazon | $232.9 billion | $280.5 billion | 20.44% |
| Alphabet | $136.8 billion | $161.9 billion | 18.35% |
| Microsoft | $110.4 billion | $125.8 billion | 13.95% |
| $55.8 billion | $70.8 billion | 26.88% | |
| Combined | $801.5 billion | $899.2 billion | 12.19% |
Services and ads drove increased revenues for the rest of Big Tech as well. Alphabet’s ad revenue from Google properties and networks increased by $20 billion. Meanwhile, Google Cloud has seen continued adoption and grown into its own $8.9 billion segment.
For Microsoft, growth in cloud computing and services led to stronger revenue in almost all segments. Most interestingly, growth for Azure services outpaced that of Office and Windows to become the company’s largest share of revenue.
And greater adoption of services and ad integration were a big boost for ad-driven Facebook. Largely due to continued increases in average revenue per user, Facebook generated an additional $20 billion in revenue.
Comparing the Tech Giants
The one company that didn’t post massive revenue increases was Apple, though it did see gains in some revenue segments.
iPhone revenue, still the cornerstone of the business, dropped by almost $25 billion. That offset an almost $10 billion increase in revenue from services and about $3 billion from iPad sales.
However, with net income of $55.2 billion, Apple leads Big Tech in both net income and market capitalization.
Big Tech: The Full Picture
| Company | Revenue (2019) | Net Income (2019) | Market Cap (July 2020) |
|---|---|---|---|
| Apple | $260.2 billion | $55.2 billion | $1.58 trillion |
| Amazon | $280.5 billion | $11.6 billion | $1.44 trillion |
| Alphabet | $161.9 billion | $34.3 billion | $1.02 trillion |
| Microsoft | $125.8 billion | $39.2 billion | $1.56 trillion |
| $70.8 billion | $18.5 billion | $665.04 billion | |
| Combined | $899.2 billion | $158.8 billion | $6.24 trillion |
Bigger Than Countries
They might have different revenue streams and margins, but together the tech giants have grown from Silicon Valley upstarts to global forces.
The tech giants combined for almost $900 billion in revenues in 2019, greater than the GDP of four of the G20 nations. By comparison, Big Tech’s earnings would make it the #18 largest country by GDP, ahead of Saudi Arabia and just behind the Netherlands.
Big Tech earns billions by capitalizing on their platforms and growing user databases. Through increased growth and adoption of software, cloud computing, and ad proliferation, those billions should continue to increase.
As technology use has increased in 2020, and is only forecast to continue growing, how much more will Big Tech be able to earn in the future?


Technology
Visualizing AI Patents by Country
See which countries have been granted the most AI patents each year, from 2012 to 2022.


Visualizing AI Patents by Country
This was originally posted on our Voronoi app. Download the app for free on iOS or Android and discover incredible data-driven charts from a variety of trusted sources.
This infographic shows the number of AI-related patents granted each year from 2010 to 2022 (latest data available). These figures come from the Center for Security and Emerging Technology (CSET), accessed via Stanford University’s 2024 AI Index Report.
From this data, we can see that China first overtook the U.S. in 2013. Since then, the country has seen enormous growth in the number of AI patents granted each year.
| Year | China | EU and UK | U.S. | RoW | Global Total |
|---|---|---|---|---|---|
| 2010 | 307 | 137 | 984 | 571 | 1,999 |
| 2011 | 516 | 129 | 980 | 581 | 2,206 |
| 2012 | 926 | 112 | 950 | 660 | 2,648 |
| 2013 | 1,035 | 91 | 970 | 627 | 2,723 |
| 2014 | 1,278 | 97 | 1,078 | 667 | 3,120 |
| 2015 | 1,721 | 110 | 1,135 | 539 | 3,505 |
| 2016 | 1,621 | 128 | 1,298 | 714 | 3,761 |
| 2017 | 2,428 | 144 | 1,489 | 1,075 | 5,136 |
| 2018 | 4,741 | 155 | 1,674 | 1,574 | 8,144 |
| 2019 | 9,530 | 322 | 3,211 | 2,720 | 15,783 |
| 2020 | 13,071 | 406 | 5,441 | 4,455 | 23,373 |
| 2021 | 21,907 | 623 | 8,219 | 7,519 | 38,268 |
| 2022 | 35,315 | 1,173 | 12,077 | 13,699 | 62,264 |
In 2022, China was granted more patents than every other country combined.
While this suggests that the country is very active in researching the field of artificial intelligence, it doesn’t necessarily mean that China is the farthest in terms of capability.
Key Facts About AI Patents
According to CSET, AI patents relate to mathematical relationships and algorithms, which are considered abstract ideas under patent law. They can also have different meaning, depending on where they are filed.
In the U.S., AI patenting is concentrated amongst large companies including IBM, Microsoft, and Google. On the other hand, AI patenting in China is more distributed across government organizations, universities, and tech firms (e.g. Tencent).
In terms of focus area, China’s patents are typically related to computer vision, a field of AI that enables computers and systems to interpret visual data and inputs. Meanwhile America’s efforts are more evenly distributed across research fields.
Learn More About AI From Visual Capitalist
If you want to see more data visualizations on artificial intelligence, check out this graphic that shows which job departments will be impacted by AI the most.

-

 Markets1 week ago
U.S. Debt Interest Payments Reach $1 Trillion
-

 Business2 weeks ago
Charted: Big Four Market Share by S&P 500 Audits
-

 Real Estate2 weeks ago
Ranked: The Most Valuable Housing Markets in America
-

 Money2 weeks ago
Which States Have the Highest Minimum Wage in America?
-

 AI2 weeks ago
Ranked: Semiconductor Companies by Industry Revenue Share
-

 Markets2 weeks ago
Ranked: The World’s Top Flight Routes, by Revenue
-

 Demographics2 weeks ago
Population Projections: The World’s 6 Largest Countries in 2075
-

 Markets2 weeks ago
The Top 10 States by Real GDP Growth in 2023