Technology
How Big Tech Makes Their Billions
Check out the 2022 edition of how Big Tech makes their billions for the latest update.
How Big Tech Makes Their Billions
Check out the 2022 edition of how Big Tech makes their billions for the latest update.
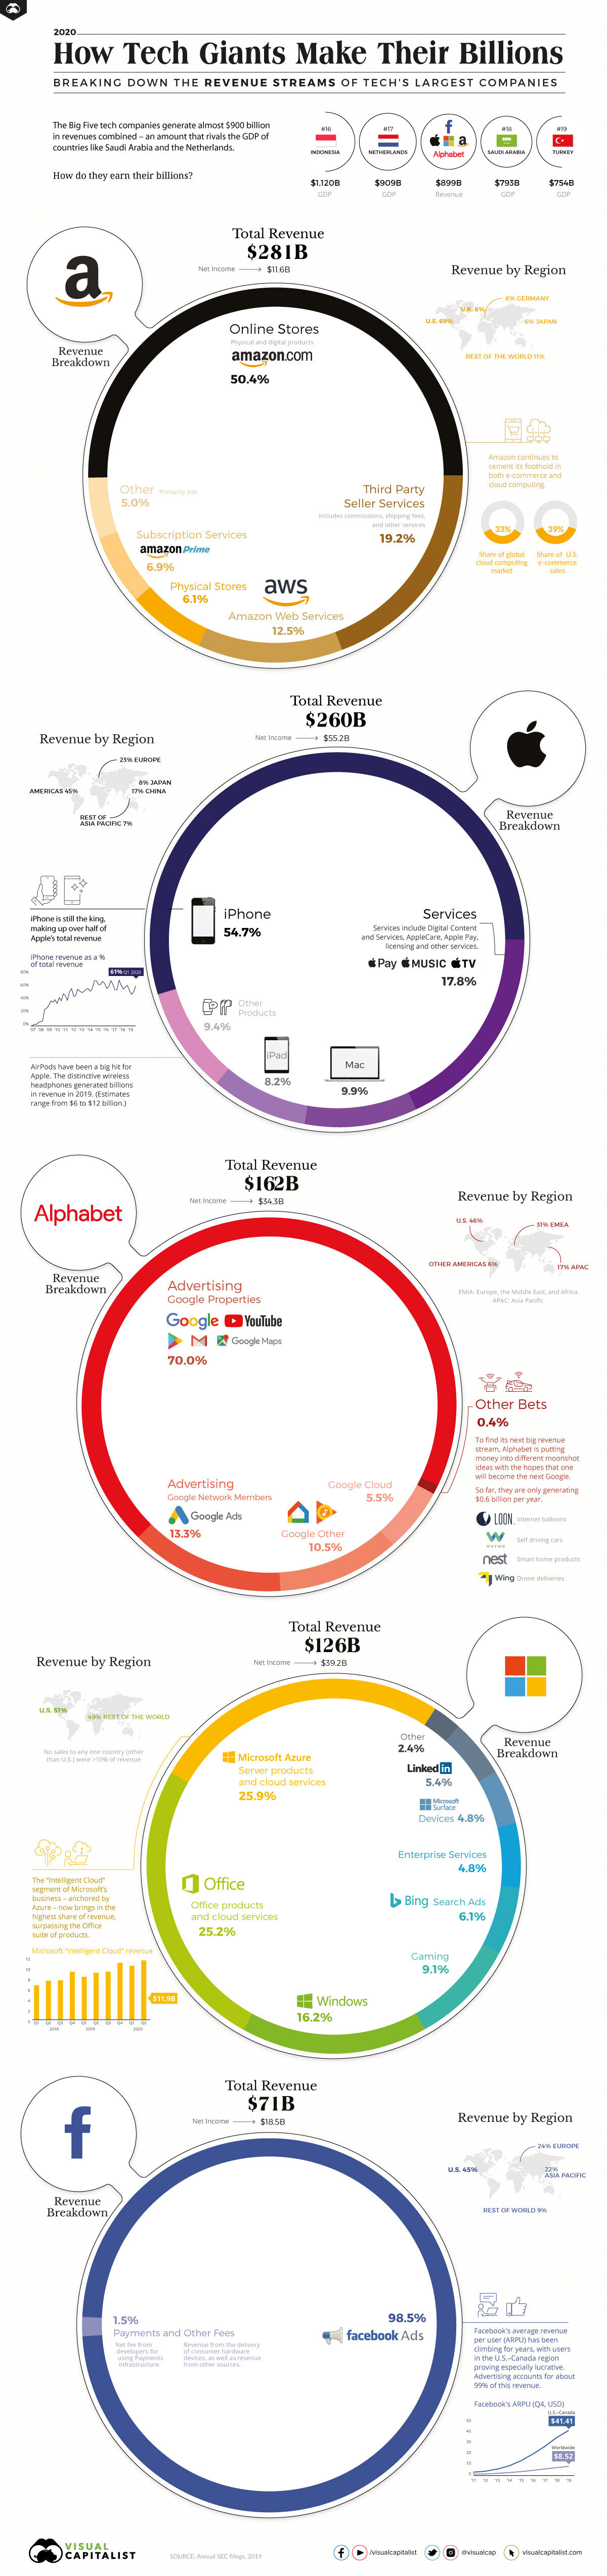
The world’s largest companies are all in technology, and four out of five of those “Big Tech” companies have grown to trillion-dollar market capitalizations.
Despite their similarities, each of the five technology companies (Amazon, Apple, Facebook, Microsoft, and Alphabet) have very different cashflow breakdowns and growth trajectories. Some have a diversified mix of applications and cloud services, products, and data accumulation, while others have a more singular focus.
But through growth in almost all segments, Big Tech has eclipsed Big Oil and other major industry groups to comprise the most valuable publicly-traded companies in the world. By continuing to grow, these companies have strengthened the financial position of their billionaire founders and led the tech-heavy NASDAQ to new record highs.
Unfortunately, with growth comes difficulty. Data-use, diversity, and treatment of workers have all become hot-button issues on a global scale, putting Big Tech on the defensive with advertisers and governments alike.
Still, even this hasn’t stopped the tech giants from (almost) all posting massive revenue growth.
Revenues for Big Tech Keep Increasing
Across the board, greater technological adoption is the biggest driver of increased revenues.
Amazon earned the most in total revenue compared with last year’s figures, with leaps in almost all of the company’s operations. Revenue from online sales and third-party seller services increased by almost $30 billion, while Amazon Web Services and Amazon Prime saw increased revenues of $15 billion combined.
The only chunk of the Amazon pie that didn’t increase were physical store sales, which have stagnated after previously being the fastest growing segment.
Big Tech Revenues (2019 vs. 2018)
| Company | Revenue (2018) | Revenue (2019) | Growth (YoY) |
|---|---|---|---|
| Apple | $265.6 billion | $260.2 billion | -2.03% |
| Amazon | $232.9 billion | $280.5 billion | 20.44% |
| Alphabet | $136.8 billion | $161.9 billion | 18.35% |
| Microsoft | $110.4 billion | $125.8 billion | 13.95% |
| $55.8 billion | $70.8 billion | 26.88% | |
| Combined | $801.5 billion | $899.2 billion | 12.19% |
Services and ads drove increased revenues for the rest of Big Tech as well. Alphabet’s ad revenue from Google properties and networks increased by $20 billion. Meanwhile, Google Cloud has seen continued adoption and grown into its own $8.9 billion segment.
For Microsoft, growth in cloud computing and services led to stronger revenue in almost all segments. Most interestingly, growth for Azure services outpaced that of Office and Windows to become the company’s largest share of revenue.
And greater adoption of services and ad integration were a big boost for ad-driven Facebook. Largely due to continued increases in average revenue per user, Facebook generated an additional $20 billion in revenue.
Comparing the Tech Giants
The one company that didn’t post massive revenue increases was Apple, though it did see gains in some revenue segments.
iPhone revenue, still the cornerstone of the business, dropped by almost $25 billion. That offset an almost $10 billion increase in revenue from services and about $3 billion from iPad sales.
However, with net income of $55.2 billion, Apple leads Big Tech in both net income and market capitalization.
Big Tech: The Full Picture
| Company | Revenue (2019) | Net Income (2019) | Market Cap (July 2020) |
|---|---|---|---|
| Apple | $260.2 billion | $55.2 billion | $1.58 trillion |
| Amazon | $280.5 billion | $11.6 billion | $1.44 trillion |
| Alphabet | $161.9 billion | $34.3 billion | $1.02 trillion |
| Microsoft | $125.8 billion | $39.2 billion | $1.56 trillion |
| $70.8 billion | $18.5 billion | $665.04 billion | |
| Combined | $899.2 billion | $158.8 billion | $6.24 trillion |
Bigger Than Countries
They might have different revenue streams and margins, but together the tech giants have grown from Silicon Valley upstarts to global forces.
The tech giants combined for almost $900 billion in revenues in 2019, greater than the GDP of four of the G20 nations. By comparison, Big Tech’s earnings would make it the #18 largest country by GDP, ahead of Saudi Arabia and just behind the Netherlands.
Big Tech earns billions by capitalizing on their platforms and growing user databases. Through increased growth and adoption of software, cloud computing, and ad proliferation, those billions should continue to increase.
As technology use has increased in 2020, and is only forecast to continue growing, how much more will Big Tech be able to earn in the future?


Technology
Ranked: Semiconductor Companies by Industry Revenue Share
Nvidia is coming for Intel’s crown. Samsung is losing ground. AI is transforming the space. We break down revenue for semiconductor companies.


Semiconductor Companies by Industry Revenue Share
This was originally posted on our Voronoi app. Download the app for free on Apple or Android and discover incredible data-driven charts from a variety of trusted sources.
Did you know that some computer chips are now retailing for the price of a new BMW?
As computers invade nearly every sphere of life, so too have the chips that power them, raising the revenues of the businesses dedicated to designing them.
But how did various chipmakers measure against each other last year?
We rank the biggest semiconductor companies by their percentage share of the industry’s revenues in 2023, using data from Omdia research.
Which Chip Company Made the Most Money in 2023?
Market leader and industry-defining veteran Intel still holds the crown for the most revenue in the sector, crossing $50 billion in 2023, or 10% of the broader industry’s topline.
All is not well at Intel, however, with the company’s stock price down over 20% year-to-date after it revealed billion-dollar losses in its foundry business.
| Rank | Company | 2023 Revenue | % of Industry Revenue |
|---|---|---|---|
| 1 | Intel | $51B | 9.4% |
| 2 | NVIDIA | $49B | 9.0% |
| 3 | Samsung Electronics | $44B | 8.1% |
| 4 | Qualcomm | $31B | 5.7% |
| 5 | Broadcom | $28B | 5.2% |
| 6 | SK Hynix | $24B | 4.4% |
| 7 | AMD | $22B | 4.1% |
| 8 | Apple | $19B | 3.4% |
| 9 | Infineon Tech | $17B | 3.2% |
| 10 | STMicroelectronics | $17B | 3.2% |
| 11 | Texas Instruments | $17B | 3.1% |
| 12 | Micron Technology | $16B | 2.9% |
| 13 | MediaTek | $14B | 2.6% |
| 14 | NXP | $13B | 2.4% |
| 15 | Analog Devices | $12B | 2.2% |
| 16 | Renesas Electronics Corporation | $11B | 1.9% |
| 17 | Sony Semiconductor Solutions Corporation | $10B | 1.9% |
| 18 | Microchip Technology | $8B | 1.5% |
| 19 | Onsemi | $8B | 1.4% |
| 20 | KIOXIA Corporation | $7B | 1.3% |
| N/A | Others | $126B | 23.2% |
| N/A | Total | $545B | 100% |
Note: Figures are rounded. Totals and percentages may not sum to 100.
Meanwhile, Nvidia is very close to overtaking Intel, after declaring $49 billion of topline revenue for 2023. This is more than double its 2022 revenue ($21 billion), increasing its share of industry revenues to 9%.
Nvidia’s meteoric rise has gotten a huge thumbs-up from investors. It became a trillion dollar stock last year, and broke the single-day gain record for market capitalization this year.
Other chipmakers haven’t been as successful. Out of the top 20 semiconductor companies by revenue, 12 did not match their 2022 revenues, including big names like Intel, Samsung, and AMD.
The Many Different Types of Chipmakers
All of these companies may belong to the same industry, but they don’t focus on the same niche.
According to Investopedia, there are four major types of chips, depending on their functionality: microprocessors, memory chips, standard chips, and complex systems on a chip.
Nvidia’s core business was once GPUs for computers (graphics processing units), but in recent years this has drastically shifted towards microprocessors for analytics and AI.
These specialized chips seem to be where the majority of growth is occurring within the sector. For example, companies that are largely in the memory segment—Samsung, SK Hynix, and Micron Technology—saw peak revenues in the mid-2010s.

-

 Markets2 weeks ago
America’s Top Companies by Revenue (1994 vs. 2023)
-

 Environment2 weeks ago
Ranked: Top Countries by Total Forest Loss Since 2001
-

 Real Estate2 weeks ago
Visualizing America’s Shortage of Affordable Homes
-

 Maps2 weeks ago
Mapped: Average Wages Across Europe
-

 Mining2 weeks ago
Charted: The Value Gap Between the Gold Price and Gold Miners
-

 Demographics2 weeks ago
Visualizing the Size of the Global Senior Population
-

 Automotive2 weeks ago
Tesla Is Once Again the World’s Best-Selling EV Company
-

 Technology2 weeks ago
Ranked: The Most Popular Smartphone Brands in the U.S.