Technology
What’s Hot (and Not) in Early Stage Tech
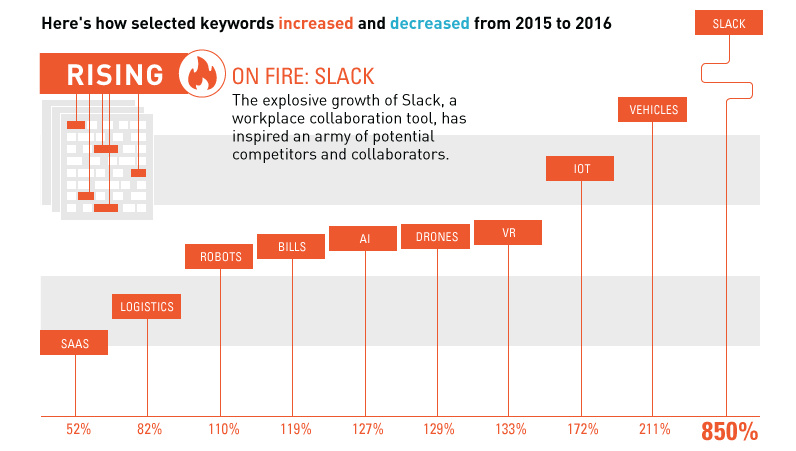
![What's Hot (and Not) in Early Stage Tech [Chart]](https://www.visualcapitalist.com/wp-content/uploads/2016/05/startup-trends-chart.png)
What’s Hot (and Not) in Early Stage Tech [Chart]
Using big data to discover what aspiring entrepreneurs are thinking
The Chart of the Week is a weekly Visual Capitalist feature on Fridays.
There are many ways to get a pulse on the startup scene to see what is trending. For example, one could look at the sub-sectors getting the most money from venture capitalists. The more deals and money hitting a sub-sector, the more it could be on its way up the ladder.
However, perhaps there is another angle that can tell us something, even if it’s simply confirming an already-held suspicion about trends in early stage tech. What are the entrepreneurs in the trenches doing? What are they focusing on, and how is that a change from previous time periods?
Big Data from Y Combinator
Y Combinator, arguably the most prominent startup accelerator on the planet, has indulged us on this hunch. Using the thousands of applications they get each year from aspiring entrepreneurs, they’ve had the foresight to methodically break them down by keyword to potentially show us trends within the pitches by startup founders.
For a wonderful post that breaks this all down, go to the company’s The Macro blog, which discusses many of these trends over the course of years in great detail.
That said, we decided to piggyback onto this interesting data set with a slightly different approach.
Method to the Madness
While the results of the keyword analysis of Y Combinator applications included many meaningful keywords, it also was cluttered with less meaningful pieces of noise. As an example, between 2015 and 2016 applications, there was a 204% increase in the use of the word “firms”. This doesn’t seem to tell us anything significant about the startup world, especially since it only went from 0.3% to 0.8% in actual usage within the scope of all applications.
To combat noise, we took the more subjective approach by identifying keywords that were more concretely associated with sub-sectors or trends. The mention of the term “IoT” in an application, for example, is more telling and suggests that an entrepreneur is pitching a startup idea related to the Internet of Things to the accelerator. More mentions of “IoT” in pitches means that ideas on the “IoT” are top of mind for aspiring entrepreneurs.
What’s Hot in Early Stage Tech?
Using the above subjective methodology, here are the increases and decreases over the last year that stood out the most to us:
The word “Slack” was used 850% more often in 2016 applications, clearly related to the popular workplace collaboration tool of the same name. Slack’s explosive growth has rippled through to the startup world, likely inspiring an army of potential competitors and collaborators in the wake of their success.
Other emerging trends that picked up steam in recent applications: virtual reality (“VR”), artificial intelligence (“AI”), internet of things (“IoT”), and “drones”. The 119% increase in the usage of the word “bills” also points to the recent attention on the fintech space.
The mention of “SaaS” (Software as a Service) also increased 52%, as it has become a preferred business model by venture capitalists.
What’s Not
The largest decrease of all terms used was that of “Bitcoin”, which dropped 62% from one year to the next. The cryptocurrency has been a popular developer target for years, but the rush to take it mainstream may now be losing steam. The world’s top performing currency in 2015 has been called dead many times before, so it is certainly no stranger to adversity.
The word “nonprofit” was also used 29% less, which may point to the recent pressure for startups to offer a more foreseeable potential return on investment for investors. The ecosystem isn’t as frothy as it once was, and nonprofit ideas may have taken a temporary tumble as a result.
“Crowdfunding” has also dropped more off the radar, receiving 25% less mentions.


Technology
Ranked: Semiconductor Companies by Industry Revenue Share
Nvidia is coming for Intel’s crown. Samsung is losing ground. AI is transforming the space. We break down revenue for semiconductor companies.


Semiconductor Companies by Industry Revenue Share
This was originally posted on our Voronoi app. Download the app for free on Apple or Android and discover incredible data-driven charts from a variety of trusted sources.
Did you know that some computer chips are now retailing for the price of a new BMW?
As computers invade nearly every sphere of life, so too have the chips that power them, raising the revenues of the businesses dedicated to designing them.
But how did various chipmakers measure against each other last year?
We rank the biggest semiconductor companies by their percentage share of the industry’s revenues in 2023, using data from Omdia research.
Which Chip Company Made the Most Money in 2023?
Market leader and industry-defining veteran Intel still holds the crown for the most revenue in the sector, crossing $50 billion in 2023, or 10% of the broader industry’s topline.
All is not well at Intel, however, with the company’s stock price down over 20% year-to-date after it revealed billion-dollar losses in its foundry business.
| Rank | Company | 2023 Revenue | % of Industry Revenue |
|---|---|---|---|
| 1 | Intel | $51B | 9.4% |
| 2 | NVIDIA | $49B | 9.0% |
| 3 | Samsung Electronics | $44B | 8.1% |
| 4 | Qualcomm | $31B | 5.7% |
| 5 | Broadcom | $28B | 5.2% |
| 6 | SK Hynix | $24B | 4.4% |
| 7 | AMD | $22B | 4.1% |
| 8 | Apple | $19B | 3.4% |
| 9 | Infineon Tech | $17B | 3.2% |
| 10 | STMicroelectronics | $17B | 3.2% |
| 11 | Texas Instruments | $17B | 3.1% |
| 12 | Micron Technology | $16B | 2.9% |
| 13 | MediaTek | $14B | 2.6% |
| 14 | NXP | $13B | 2.4% |
| 15 | Analog Devices | $12B | 2.2% |
| 16 | Renesas Electronics Corporation | $11B | 1.9% |
| 17 | Sony Semiconductor Solutions Corporation | $10B | 1.9% |
| 18 | Microchip Technology | $8B | 1.5% |
| 19 | Onsemi | $8B | 1.4% |
| 20 | KIOXIA Corporation | $7B | 1.3% |
| N/A | Others | $126B | 23.2% |
| N/A | Total | $545B | 100% |
Note: Figures are rounded. Totals and percentages may not sum to 100.
Meanwhile, Nvidia is very close to overtaking Intel, after declaring $49 billion of topline revenue for 2023. This is more than double its 2022 revenue ($21 billion), increasing its share of industry revenues to 9%.
Nvidia’s meteoric rise has gotten a huge thumbs-up from investors. It became a trillion dollar stock last year, and broke the single-day gain record for market capitalization this year.
Other chipmakers haven’t been as successful. Out of the top 20 semiconductor companies by revenue, 12 did not match their 2022 revenues, including big names like Intel, Samsung, and AMD.
The Many Different Types of Chipmakers
All of these companies may belong to the same industry, but they don’t focus on the same niche.
According to Investopedia, there are four major types of chips, depending on their functionality: microprocessors, memory chips, standard chips, and complex systems on a chip.
Nvidia’s core business was once GPUs for computers (graphics processing units), but in recent years this has drastically shifted towards microprocessors for analytics and AI.
These specialized chips seem to be where the majority of growth is occurring within the sector. For example, companies that are largely in the memory segment—Samsung, SK Hynix, and Micron Technology—saw peak revenues in the mid-2010s.

-

 Green2 weeks ago
Ranked: Top Countries by Total Forest Loss Since 2001
-

 Travel2 weeks ago
Ranked: The World’s Top Flight Routes, by Revenue
-

 Technology2 weeks ago
Ranked: Semiconductor Companies by Industry Revenue Share
-

 Money2 weeks ago
Which States Have the Highest Minimum Wage in America?
-

 Real Estate2 weeks ago
Ranked: The Most Valuable Housing Markets in America
-

 Markets2 weeks ago
Charted: Big Four Market Share by S&P 500 Audits
-

 AI2 weeks ago
The Stock Performance of U.S. Chipmakers So Far in 2024
-

 Automotive2 weeks ago
Almost Every EV Stock is Down After Q1 2024