Politics
A Recent History of U.S. Sanctions on Russia


A Recent History of U.S. Sanctions Against Russia
When a direct military confrontation is off the table, how should countries respond to acts of foreign aggression?
One tactic is sanctioning, which applies economic restrictions on a country’s government, businesses, and even individual citizens. In theory, these penalties create enough impact to dissuade further hostility.
Today, the U.S. maintains more sanctions than any other country, and one of its most comprehensive programs is aimed at Russia. To learn more, we’ve compiled an overview of these sanctions using data from the Congressional Research Service and U.S. Treasury.
Sanctions by Catalyst Event
Sanctions are often introduced after a President issues an executive order (EO) that declares a national emergency. This provides special powers to regulate commerce with an aggressor nation.
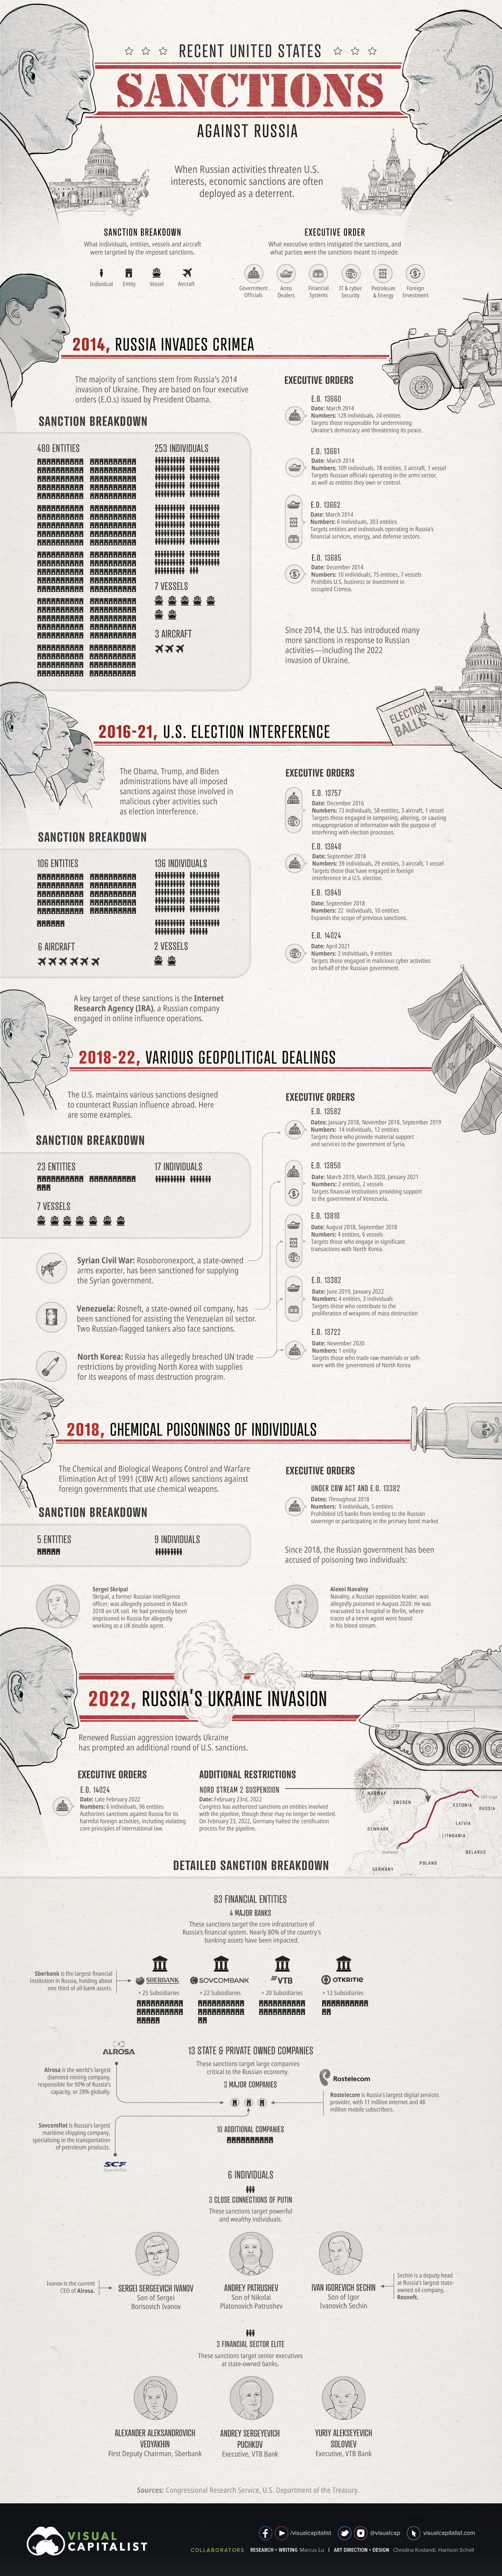
Our starting point will be Russia’s 2014 invasion of Ukraine, as this is where a majority of ongoing sanctions have originated.
Catalyst: 2014 Ukraine Invasion
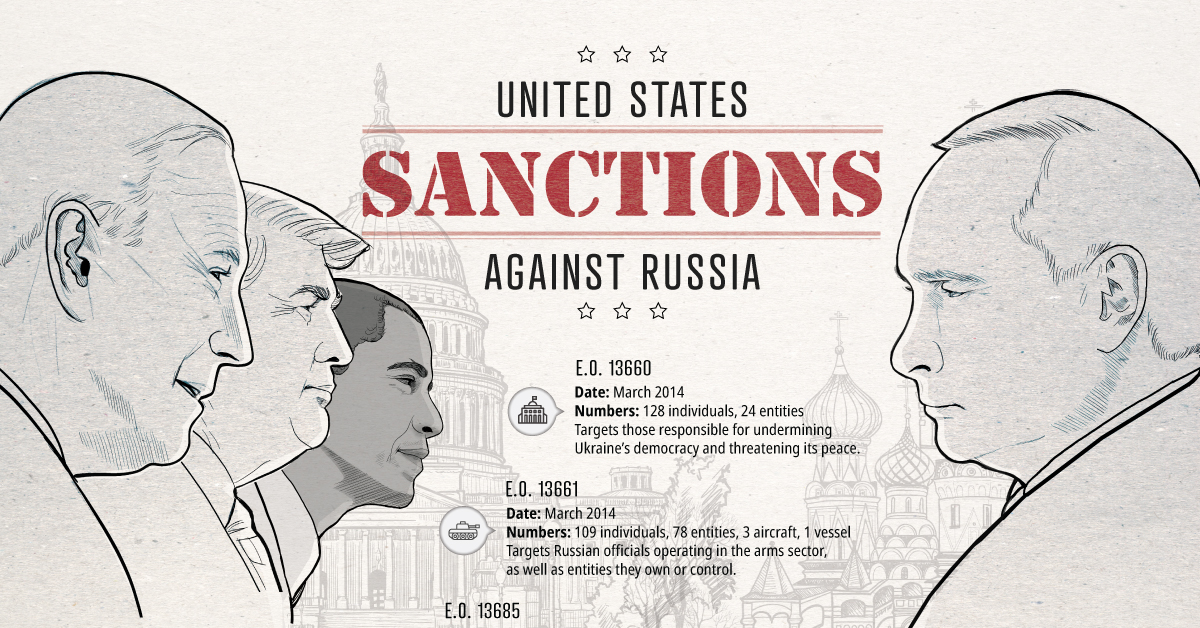
On March 18, 2014, Russia annexed Crimea from Ukraine. This was denounced by the U.S. and its allies, leading them to impose wide-reaching sanctions. President Obama’s EOs are listed below.
| Executive order (EO) | Date of sanctions | Purpose |
|---|---|---|
| EO 13660 | March 2014 | Targets those responsible for undermining Ukraine’s democracy |
| EO 13661 | March 2014 | Targets Russian officials operating in the arms sector |
| EO 13662 | March 2014 | Targets those operating in Russia’s financial, energy, and defense sectors |
| EO 13685 | December 2014 | Prohibits U.S. business in occupied Crimea |
Altogether, these sanctions affect 480 entities (includes businesses and government agencies), 253 individuals, 7 vessels, and 3 aircraft.
Sanctions against ships and planes may seem odd, but these assets are often owned by sanctioned entities. For example, in February 2022, France seized a cargo ship belonging to a sanctioned Russian bank.
Catalyst: U.S. Election Interference
The Obama, Trump, and Biden administrations have all imposed sanctions against Russia for its malicious cyber activities.
| Executive order (EO) | Date of sanctions | Purpose |
|---|---|---|
| EO 13757 | December 2016 | Targets those who aim to interfere with the election process |
| EO 13848 | September 2018 | Targets those that have engaged in foreign interference of a U.S. election |
| EO 13849 | September 2018 | Expands the scope of previous sanctions |
| EO 14024 | April 2021 | Targets those engaged in malicious cyber activities on behalf of the Russian government |
Altogether, these sanctions affect 106 entites, 136 individuals, 6 aircraft, and 2 vessels. A critical target is the Internet Research Agency (IRA), a Russian company notorious for its online influence operations.
Prior to the 2016 election, 3,000 IRA-sponsored ads reached up to 10 million Americans on Facebook. This problem escalated in the run-up to the 2020 election, with 140 million Americans being exposed to propaganda on a monthly basis.
Catalyst: Various Geopolitical Dealings
The U.S. maintains various sanctions designed to counteract Russian influence in Syria, Venezuela, and North Korea.
| Executive order (EO) | Date of sanctions* | Purpose |
|---|---|---|
| EO 13582 | January 2018, November 2018, September 2019 | Targets those who provide material support to the government of Syria |
| EO 13850 | March 2019, March 2020, January 2021 | Targets financial institutions providing support to the government of Venezuela |
| EO 13810 | August 2018, September 2018 | Targets those who engage in significant transactions with North Korea |
| EO 13382 | June 2019, January 2022 | Targets those who contribute to the proliferation of weapons of mass destruction |
| EO 13722 | November 2020 | Targets those who trade raw materials or software with the government of North Korea |
*These are recent sanctions pursuant to EOs that were issued many years prior. For example, EO 13582 was introduced in August 2011.
These sanctions impact 23 entities, 17 individuals, and 7 vessels. Specific entities include Rosoboronexport, a state-owned arms exporter which was sanctioned for supplying the Syrian government.
As of December 2020, Syria’s government was responsible for the deaths of 156,329 people (civilians and combatants) in the civil war.
Catalyst: Chemical Poisonings of Individuals
The Russian government has been accused of poisoning two individuals in recent years.
The first incident involved Sergei Skripal, a former Russian intelligence officer who was allegedly poisoned in March 2018 on UK soil. The second, Alexei Navalny, a Russian opposition leader, was allegedly poisoned in August 2020.
The Chemical and Biological Weapons Control and Warfare Elimination Act of 1991 (CBW Act) allows sanctions against foreign governments that use chemical weapons. Nine individuals and five entities were sanctioned as a result of the two cases.
Catalyst: 2022 Ukraine Invasion
The U.S. has introduced many more sanctions in response to Russia’s latest invasion of Ukraine.
EO 14024, which was issued in February 2022, targets Russia’s major financial institutions and their subsidiaries (83 entities in total). Included in this list are the country’s two largest banks, Sberbank and VTB Bank. Together, they hold more than half of all Russian banking assets.
Also targeted are 13 private and state-owned companies deemed to be critical to the Russian economy. Included in this 13 are Rostelecom, Russia’s largest digital services provider, and Alrosa, the world’s largest diamond mining company.
Do Sanctions Work?
Proving that a sanction was solely responsible for an outcome is impossible, though there have been successes in the past. For example, many agree that sanctions played an important role in ending Libya’s weapons of mass destruction programs.
Critics of sanctions argue that imposing economic distress on a country can lead to unintended consequences. One of these is a shift away from the U.S. financial system.
There is no alternative to the dollar and no export market as attractive as the United States. But if Washington continues to force other nations to go along with policies that they consider both illegal and unwise … they are likely to shift away from the United States’ economy and financial system.
Jacob J. Lew, Former Secretary of the Treasury
In other words, sanctions can create an impact as long as the U.S. dollar continues to reign supreme.


Economy
The Bloc Effect: International Trade with Geopolitical Allies on the Rise
Rising geopolitical tensions are shaping the future of international trade, but what is the effect on trading among G7 and BRICS countries?


The Bloc Effect: International Trade with Allies on the Rise
International trade has become increasingly fragmented over the last five years as countries have shifted to trading more with their geopolitical allies.
This graphic from The Hinrich Foundation, the first in a three-part series covering the future of trade, provides visual context to the growing divide in trade in G7 and pre-expansion BRICS countries, which are used as proxies for geopolitical blocs.
Trade Shifts in G7 and BRICS Countries
This analysis uses IMF data to examine differences in shares of exports within and between trading blocs from 2018 to 2023. For example, we looked at the percentage of China’s exports with other BRICS members as well as with G7 members to see how these proportions shifted in percentage points (pp) over time.
Countries traded nearly $270 billion more with allies in 2023 compared to 2018. This shift came at the expense of trade with rival blocs, which saw a decline of $314 billion.
Country Change in Exports Within Bloc (pp) Change in Exports With Other Bloc (pp)
🇮🇳 India 0.0 3.9
🇷🇺 Russia 0.7 -3.8
🇮🇹 Italy 0.8 -0.7
🇨🇦 Canada 0.9 -0.7
🇫🇷 France 1.0 -1.1
🇪🇺 EU 1.1 -1.5
🇩🇪 Germany 1.4 -2.1
🇿🇦 South Africa 1.5 1.5
🇺🇸 U.S. 1.6 -0.4
🇯🇵 Japan 2.0 -1.7
🇨🇳 China 2.1 -5.2
🇧🇷 Brazil 3.7 -3.3
🇬🇧 UK 10.2 0.5
All shifts reported are in percentage points. For example, the EU saw its share of exports to G7 countries rise from 74.3% in 2018 to 75.4% in 2023, which equates to a 1.1 percentage point increase.
The UK saw the largest uptick in trading with other countries within the G7 (+10.2 percentage points), namely the EU, as the post-Brexit trade slump to the region recovered.
Meanwhile, the U.S.-China trade dispute caused China’s share of exports to the G7 to fall by 5.2 percentage points from 2018 to 2023, the largest decline in our sample set. In fact, partly as a result of the conflict, the U.S. has by far the highest number of harmful tariffs in place.
The Russia-Ukraine War and ensuing sanctions by the West contributed to Russia’s share of exports to the G7 falling by 3.8 percentage points over the same timeframe.
India, South Africa, and the UK bucked the trend and continued to witness advances in exports with the opposing bloc.
Average Trade Shifts of G7 and BRICS Blocs
Though results varied significantly on a country-by-country basis, the broader trend towards favoring geopolitical allies in international trade is clear.
Bloc Change in Exports Within Bloc (pp) Change in Exports With Other Bloc (pp)
Average 2.1 -1.1
BRICS 1.6 -1.4
G7 incl. EU 2.4 -1.0
Overall, BRICS countries saw a larger shift away from exports with the other bloc, while for G7 countries the shift within their own bloc was more pronounced. This implies that though BRICS countries are trading less with the G7, they are relying more on trade partners outside their bloc to make up for the lost G7 share.
A Global Shift in International Trade and Geopolitical Proximity
The movement towards strengthening trade relations based on geopolitical proximity is a global trend.
The United Nations categorizes countries along a scale of geopolitical proximity based on UN voting records.
According to the organization’s analysis, international trade between geopolitically close countries rose from the first quarter of 2022 (when Russia first invaded Ukraine) to the third quarter of 2023 by over 6%. Conversely, trade with geopolitically distant countries declined.
The second piece in this series will explore China’s gradual move away from using the U.S. dollar in trade settlements.
Visit the Hinrich Foundation to learn more about the future of geopolitical trade

-

 Economy19 hours ago
Economic Growth Forecasts for G7 and BRICS Countries in 2024
The IMF has released its economic growth forecasts for 2024. How do the G7 and BRICS countries compare?
-

 United States1 week ago
Ranked: The Largest U.S. Corporations by Number of Employees
We visualized the top U.S. companies by employees, revealing the massive scale of retailers like Walmart, Target, and Home Depot.
-

 Economy2 weeks ago
Where U.S. Inflation Hit the Hardest in March 2024
We visualized product categories that saw the highest % increase in price due to U.S. inflation as of March 2024.
-

 Economy4 weeks ago
G20 Inflation Rates: Feb 2024 vs COVID Peak
We visualize inflation rates across G20 countries as of Feb 2024, in the context of their COVID-19 pandemic peak.
-

 Economy1 month ago
Mapped: Unemployment Claims by State
This visual heatmap of unemployment claims by state highlights New York, California, and Alaska leading the country by a wide margin.
-

 Economy2 months ago
Confidence in the Global Economy, by Country
Will the global economy be stronger in 2024 than in 2023?

-

 Markets1 week ago
U.S. Debt Interest Payments Reach $1 Trillion
-

 Markets2 weeks ago
Ranked: The Most Valuable Housing Markets in America
-

 Money2 weeks ago
Which States Have the Highest Minimum Wage in America?
-

 AI2 weeks ago
Ranked: Semiconductor Companies by Industry Revenue Share
-

 Markets2 weeks ago
Ranked: The World’s Top Flight Routes, by Revenue
-

 Countries2 weeks ago
Population Projections: The World’s 6 Largest Countries in 2075
-

 Markets2 weeks ago
The Top 10 States by Real GDP Growth in 2023
-

 Money2 weeks ago
The Smallest Gender Wage Gaps in OECD Countries