Personal Finance
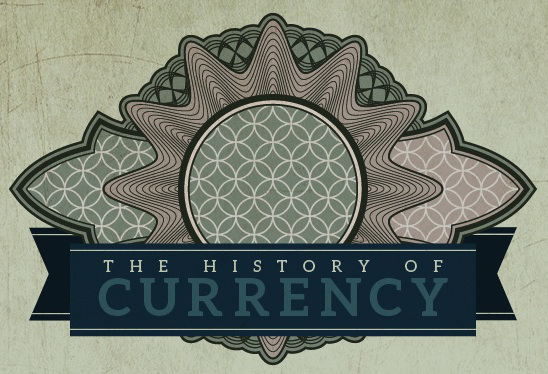
The History of Currency in 10 Different Countries

The History of Currency in 10 Different Countries
Even though there are short of 200 official fiat currencies today, throughout history there have been thousands of currencies that were once used for trade. The above infographic documents the history of currency in 10 different countries of significance.
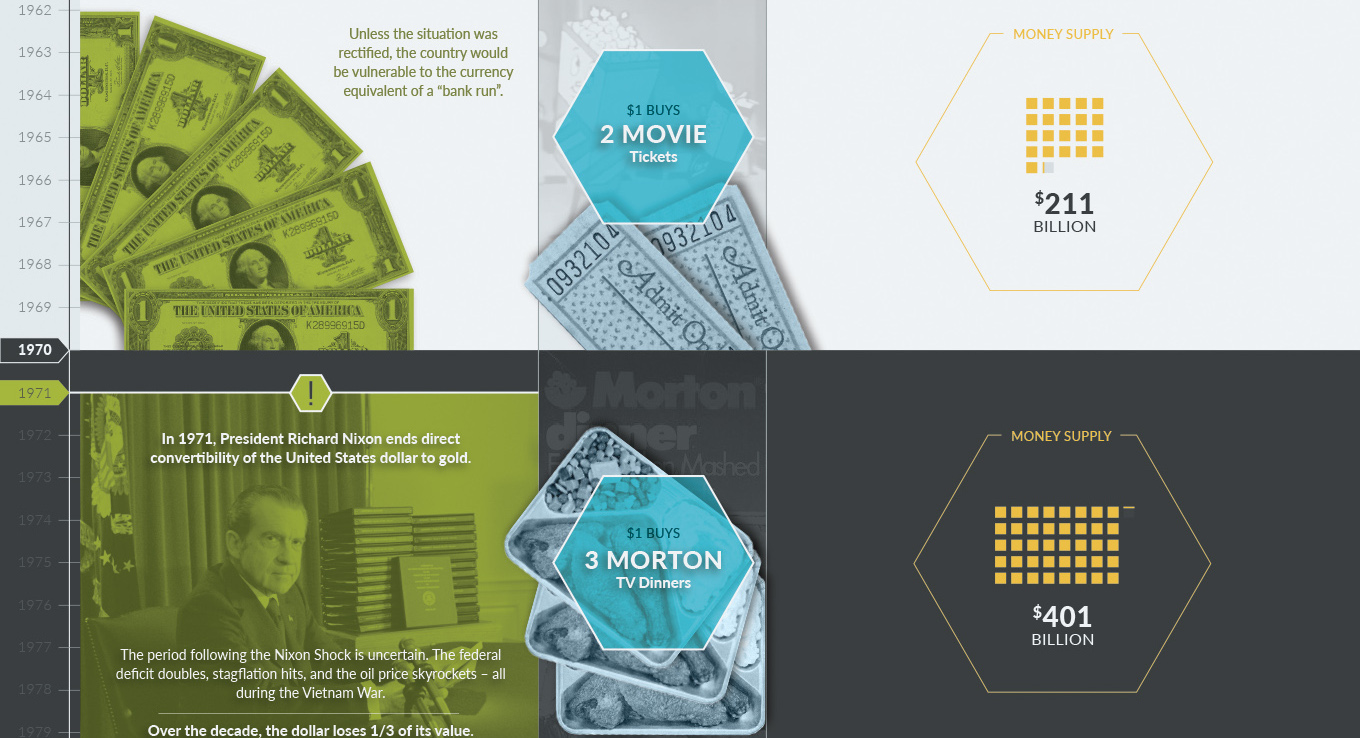
There are some interesting lessons to be learned from this lengthy and often tumultuous history. For example, the Romans were really the first to debase their currency in a significant way, and many historians believe that this was a key factor in contributing to the downfall of the empire. Unfortunately, we have not learned from tragic events such as this (which helped cause the Dark Ages), and countless other currencies have also bit the dust since then.
One study of 775 fiat currencies found the average lifespan of a currency to be just 27 years. Here’s the breakdown:
- 20% currencies failed through hyperinflation
- 21% were destroyed through war
- 12% were destroyed through independence
- 24% were “monetarily reformed”
- 23% are still in circulation
It seems like a foregone conclusion that some of the currencies listed in the above infographic may not exist in 10 years, or perhaps they get “monetarily reformed”. In any case, it’s worth noting that in today’s interconnected world, it may be easier to stave off the death of one currency through global intervention. However, systematically there is far greater risk. If one currency fails, the possibility also exists for many others to share the same fate through the domino effect.
Investors should study currency history, and as part of a smart portfolio they should protect their hard earned wealth and savings in a defensive fashion. Black swans do happen, and even the crisis in the tiny country of Cyprus had people reeling. The potential for something much bigger is inevitably a possibility – it is just a matter of when and how.
Original graphic from: ZH


Personal Finance
Chart: The Declining Value of the U.S. Federal Minimum Wage
This graphic compares the nominal vs. inflation-adjusted value of the U.S. minimum wage, from 1940 to 2023.


The Declining Value of the U.S. Federal Minimum Wage
This was originally posted on our Voronoi app. Download the app for free on iOS or Android and discover incredible data-driven charts from a variety of trusted sources.
This graphic illustrates the history of the U.S. federal minimum wage using data compiled by Statista, in both nominal and real (inflation-adjusted) terms. The federal minimum wage was raised to $7.25 per hour in July 2009, where it has remained ever since.
Nominal vs. Real Value
The data we used to create this graphic can be found in the table below.
| Year | Nominal value ($/hour) | Real value ($/hour) |
|---|---|---|
| 1940 | 0.3 | 6.5 |
| 1945 | 0.4 | 6.82 |
| 1950 | 0.75 | 9.64 |
| 1955 | 0.75 | 8.52 |
| 1960 | 1 | 10.28 |
| 1965 | 1.25 | 12.08 |
| 1970 | 1.6 | 12.61 |
| 1975 | 2.1 | 12.04 |
| 1980 | 3.1 | 11.61 |
| 1985 | 3.35 | 9.51 |
| 1990 | 3.8 | 8.94 |
| 1995 | 4.25 | 8.49 |
| 2000 | 5.15 | 9.12 |
| 2005 | 5.15 | 8.03 |
| 2010 | 7.25 | 10.09 |
| 2015 | 7.25 | 9.3 |
| 2018 | 7.25 | 8.78 |
| 2019 | 7.25 | 8.61 |
| 2020 | 7.25 | 8.58 |
| 2021 | 7.25 | 8.24 |
| 2022 | 7.25 | 7.61 |
| 2023 | 7.25 | 7.25 |
What our graphic shows is how inflation has eroded the real value of the U.S. minimum wage over time, despite nominal increases.
For instance, consider the year 1960, when the federal minimum wage was $1 per hour. After accounting for inflation, this would be worth around $10.28 today!
The two lines converge at 2023 because the nominal and real value are identical in present day terms.
Many States Have Their Own Minimum Wage
According to the National Conference of State Legislatures (NCSL), 30 states and Washington, D.C. have implemented a minimum wage that is higher than $7.25.
The following states have adopted the federal minimum: Georgia, Idaho, Indiana, Iowa, Kansas, Kentucky, New Hampshire, North Carolina, North Dakota, Oklahoma, Pennsylvania, Texas, Utah, Wisconsin, and Wyoming.
Meanwhile, the states of Alabama, Louisiana, Mississippi, South Carolina, and Tennessee have no wage minimums, but have to follow the federal minimum.
How Does the U.S. Minimum Wage Rank Globally?
If you found this topic interesting, check out Mapped: Minimum Wage Around the World to see which countries have the highest minimum wage in monthly terms, as of January 2023.

-

 Mining1 week ago
Gold vs. S&P 500: Which Has Grown More Over Five Years?
-

 Markets2 weeks ago
Ranked: The Most Valuable Housing Markets in America
-

 Money2 weeks ago
Which States Have the Highest Minimum Wage in America?
-

 AI2 weeks ago
Ranked: Semiconductor Companies by Industry Revenue Share
-

 Markets2 weeks ago
Ranked: The World’s Top Flight Routes, by Revenue
-

 Countries2 weeks ago
Population Projections: The World’s 6 Largest Countries in 2075
-

 Markets2 weeks ago
The Top 10 States by Real GDP Growth in 2023
-

 Demographics2 weeks ago
The Smallest Gender Wage Gaps in OECD Countries