Misc
Here are 15 Common Data Fallacies to Avoid
In today’s tech-driven economy, data is essential for gaining new insights, making decisions, and building products.
In fact, there is so much data out there, that the quantity of it is doubling every two years—and by 2025, there will be 175,000 exabytes of data in existence.
This is an unprecedented figure, and it’s hard to put into perspective. To give you some sense, a single exabyte is equal to 1,000,000,000 GB of data, and five exabytes has been said to be roughly equal to “all of the words ever spoken by mankind”.
Common Fallacies With Data
As you can imagine, digging through all of this data can be quite the challenge.
Data comes in many different forms and not all of them are easy to analyze. As a result, it is tempting to take shortcuts with data, or to try and fit the incoming data we receive into our pre-conceived notions of how things ought to be.
Today’s infographic comes to us from Geckoboard and it shows the common mistakes that people make in analyzing data. We’ve reformatted their PDF to fit here.
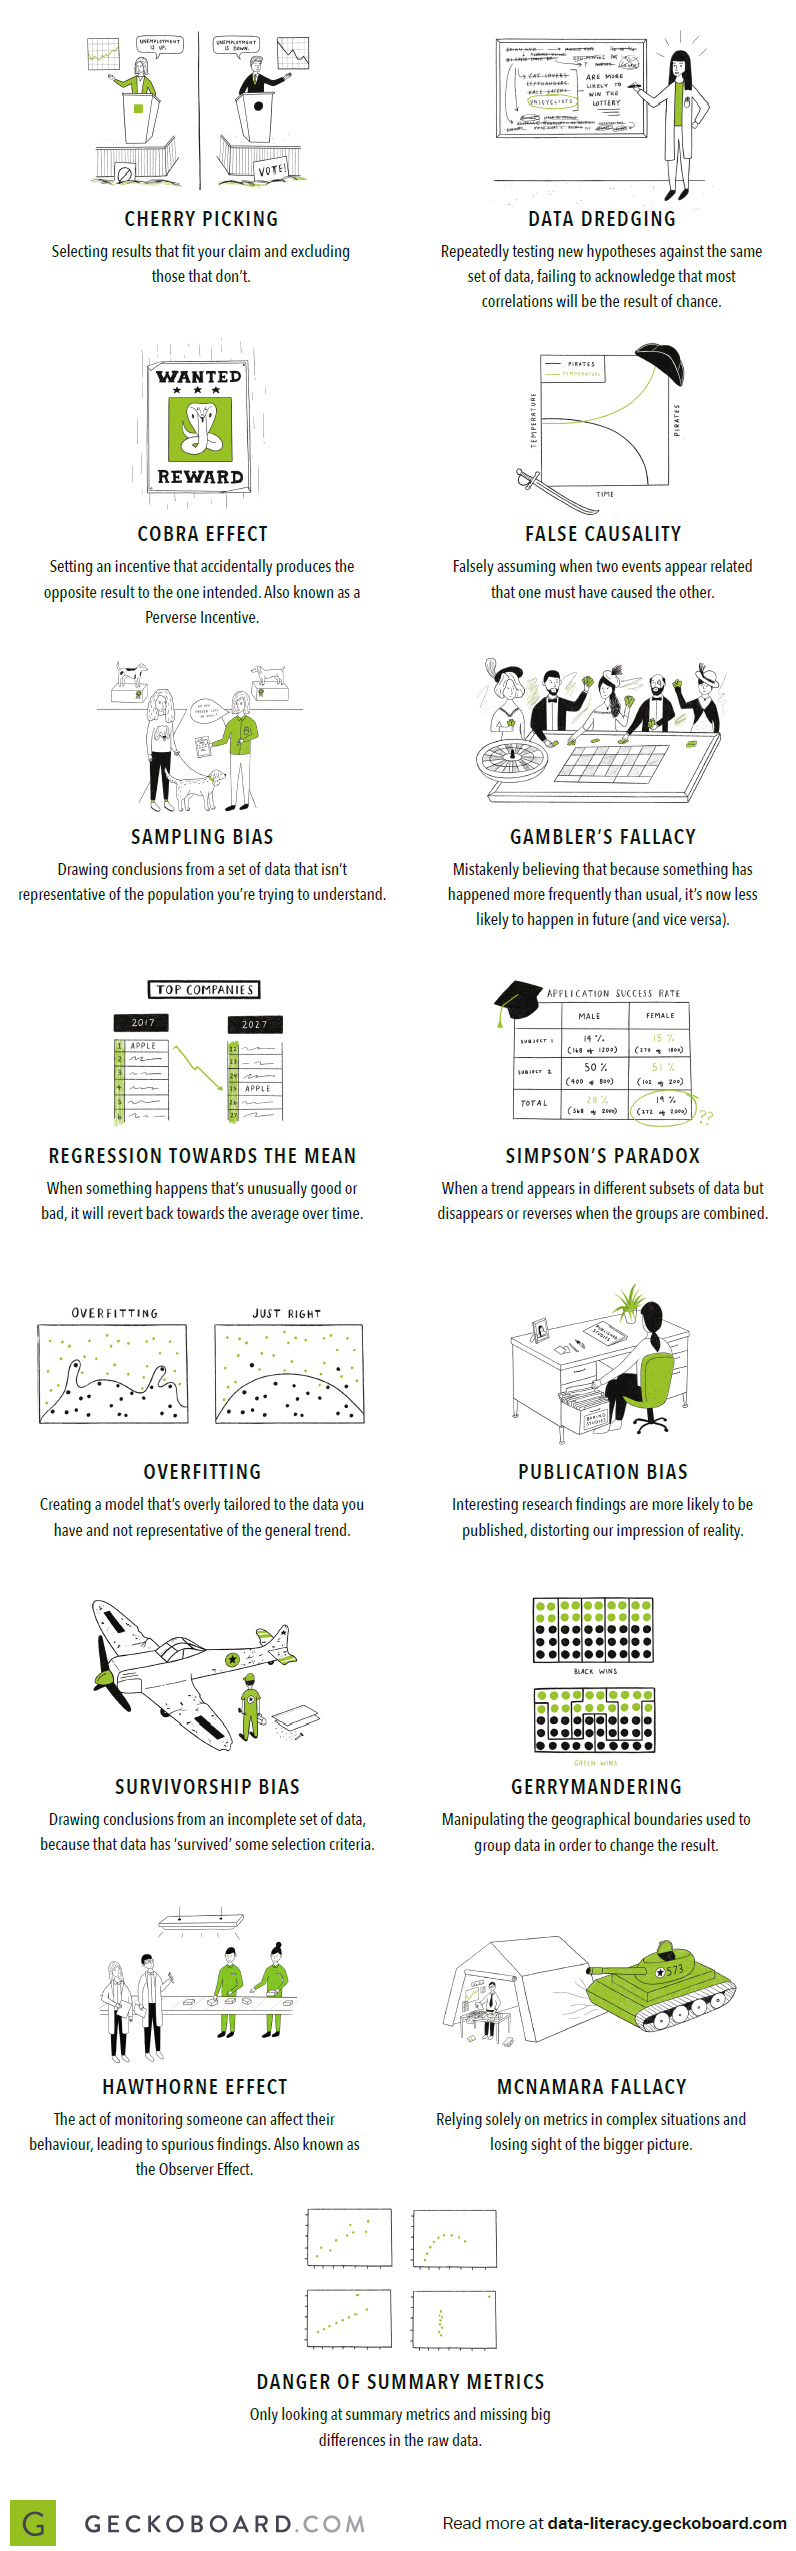
15 Common Data Fallacies
How do we avoid painting a bullseye around the arrow, so that we can interpret the meaning of data in a logical, consistent, and methodological way?
The key is to understand common mistakes that people make with data, and why these errors skew our interpretations.
Examples of Fallacies
Here are four examples of fallacies, and why each is considered a faux-pas by data scientists.
1. Survivorship Bias
When people analyze the qualities it takes to be a successful entrepreneur, we typically look at the existing population of established entrepreneurs for clues. However, by limiting our sample just to this “surviving” group of entrepreneurs, we run the risk of survivorship bias.
There are lessons we can learn from all of the entrepreneurs who have failed—they are just much harder to find. Integrating that data into the story can help complete a much fuller picture.
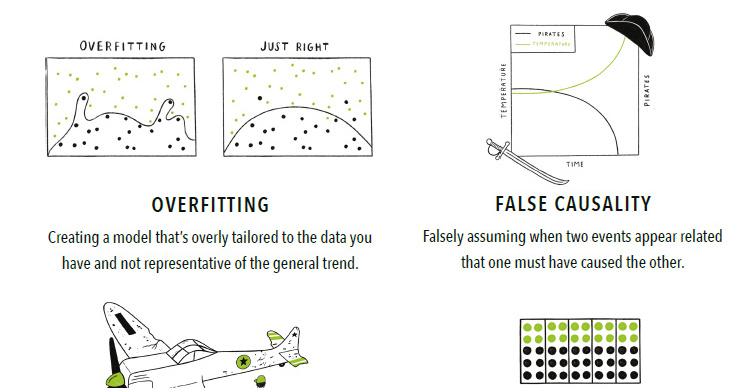
2. False Causality
Did you know that there is a 95% correlation between the marriage rate in Kentucky and the amount of people who drown each year from falling out of fishing boats? (See it, and other bizarre correlations here)
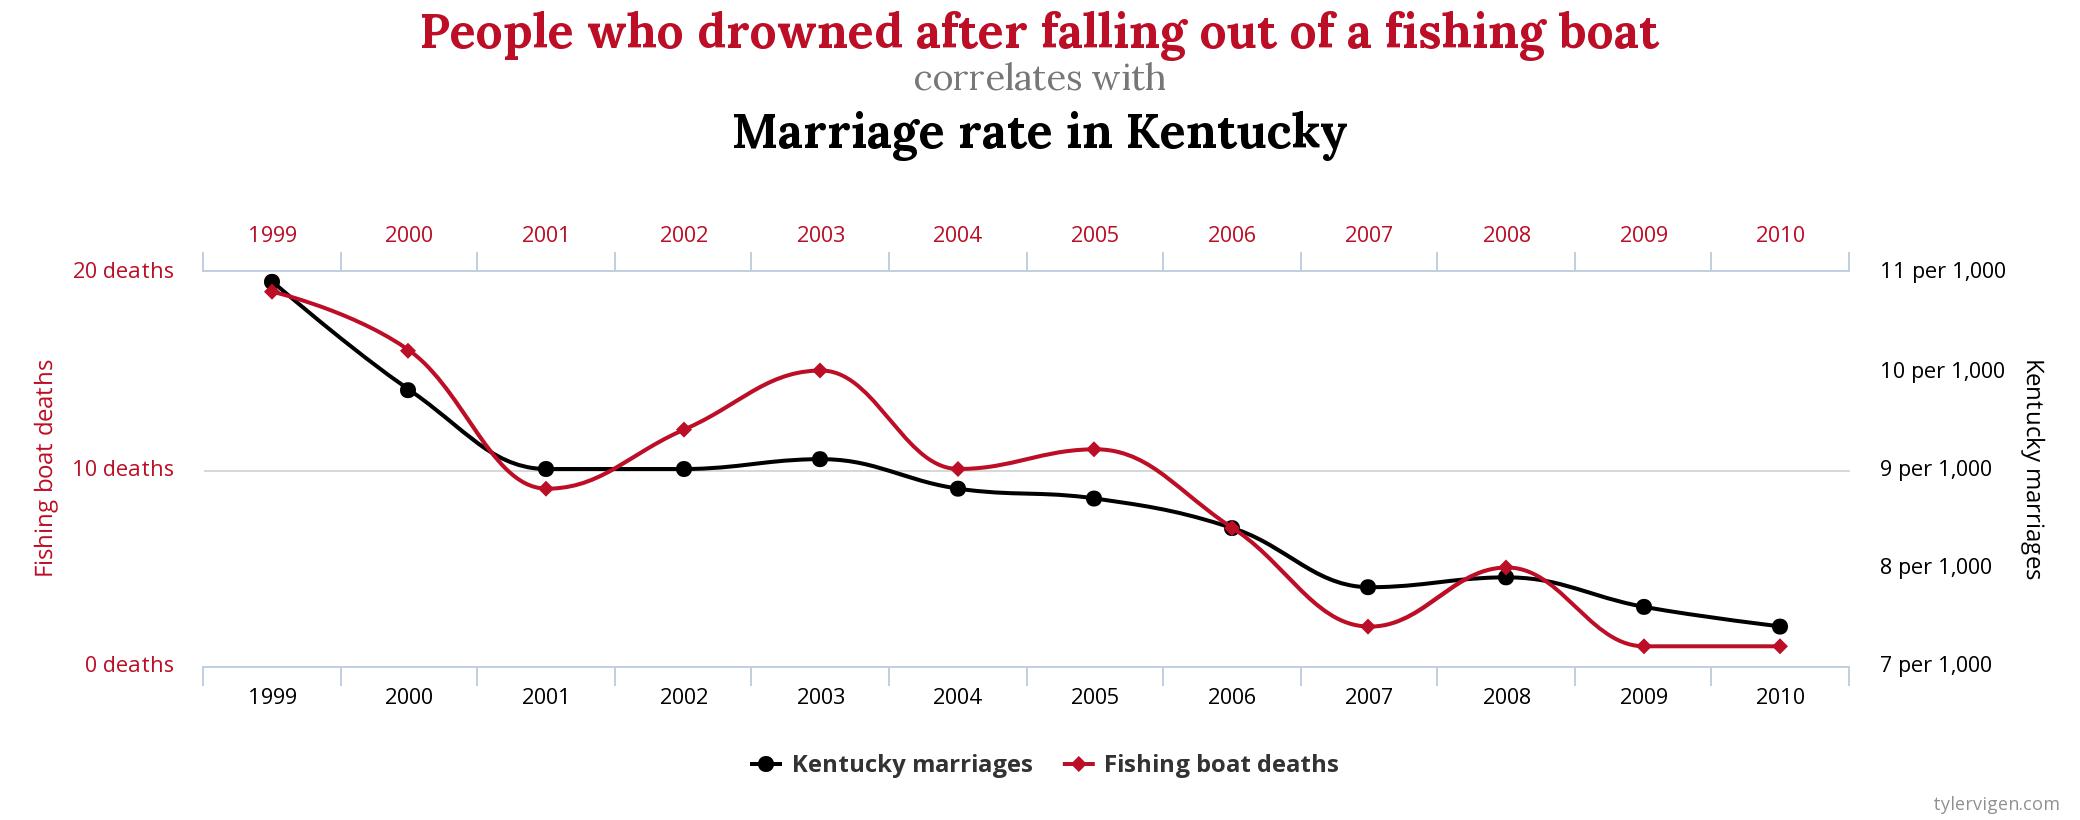
Does this mean that there is some sort of relationship between the two variables?
Finding a high level of correlation can happen simply by chance—but awarding false causality is one of the most amateur statistical mistakes in the book.
3. The Gambler’s Fallacy
If the roulette wheel turns up black for 26 times in a row, does that mean that it will revert back to red on the next spin?
It’s easy to say that the odds don’t change, but imagine being in the moment. The Gambler’s Fallacy happens with data analysis as well: just because something happens unusually frequently over a period of time doesn’t mean that nature will “even it out”.
4. The Cobra Effect
Data can be used to measure progress in achieving business goals, but what if there is incentive to game these goals?
Wells Fargo, in an effort to upsell existing clients, introduced an incentive called “eight is great”. In short, their employees were encouraged to sell eight accounts per customer, which could take the form of credit cards, savings accounts, and other financial services.
In an example of good intentions gone awry, Wells Fargo employees began breaking the rules to meet their targets. Millions of unauthorized credit card and deposit accounts were opened based on this perverse incentive, and the bank was eventually ordered to pay a $142 million settlement.


VC+
VC+: Get Our Key Takeaways From the IMF’s World Economic Outlook
A sneak preview of the exclusive VC+ Special Dispatch—your shortcut to understanding IMF’s World Economic Outlook report.

Have you read IMF’s latest World Economic Outlook yet? At a daunting 202 pages, we don’t blame you if it’s still on your to-do list.
But don’t worry, you don’t need to read the whole April release, because we’ve already done the hard work for you.
To save you time and effort, the Visual Capitalist team has compiled a visual analysis of everything you need to know from the report—and our upcoming VC+ Special Dispatch will be available exclusively to VC+ members on Thursday, April 25th.
If you’re not already subscribed to VC+, make sure you sign up now to receive the full analysis of the IMF report, and more (we release similar deep dives every week).
For now, here’s what VC+ members can expect to receive.
Your Shortcut to Understanding IMF’s World Economic Outlook
With long and short-term growth prospects declining for many countries around the world, this Special Dispatch offers a visual analysis of the key figures and takeaways from the IMF’s report including:
- The global decline in economic growth forecasts
- Real GDP growth and inflation forecasts for major nations in 2024
- When interest rate cuts will happen and interest rate forecasts
- How debt-to-GDP ratios have changed since 2000
- And much more!

Get the Full Breakdown in the Next VC+ Special Dispatch
VC+ members will receive the full Special Dispatch on Thursday, April 25th.
Make sure you join VC+ now to receive exclusive charts and the full analysis of key takeaways from IMF’s World Economic Outlook.
Don’t miss out. Become a VC+ member today.
What You Get When You Become a VC+ Member
VC+ is Visual Capitalist’s premium subscription. As a member, you’ll get the following:
- Special Dispatches: Deep dive visual briefings on crucial reports and global trends
- Markets This Month: A snappy summary of the state of the markets and what to look out for
- The Trendline: Weekly curation of the best visualizations from across the globe
- Global Forecast Series: Our flagship annual report that covers everything you need to know related to the economy, markets, geopolitics, and the latest tech trends
- VC+ Archive: Hundreds of previously released VC+ briefings and reports that you’ve been missing out on, all in one dedicated hub
You can get all of the above, and more, by joining VC+ today.

-

 Green1 week ago
Ranked: The Countries With the Most Air Pollution in 2023
-

 AI2 weeks ago
The Stock Performance of U.S. Chipmakers So Far in 2024
-

 Markets2 weeks ago
Charted: Big Four Market Share by S&P 500 Audits
-

 Real Estate2 weeks ago
Ranked: The Most Valuable Housing Markets in America
-

 Money2 weeks ago
Which States Have the Highest Minimum Wage in America?
-

 AI2 weeks ago
Ranked: Semiconductor Companies by Industry Revenue Share
-

 Travel2 weeks ago
Ranked: The World’s Top Flight Routes, by Revenue
-

 Countries2 weeks ago
Population Projections: The World’s 6 Largest Countries in 2075