Markets
What Happens To Trading During a Market Crash?
It’s hard to predict when a stock market crash will occur, so the best defense is to be prepared.
Today’s infographic comes to us from StocksToTrade.com, and it explains what happens when a large enough drop in the market triggers a “circuit breaker”, or a temporary halt in trading.
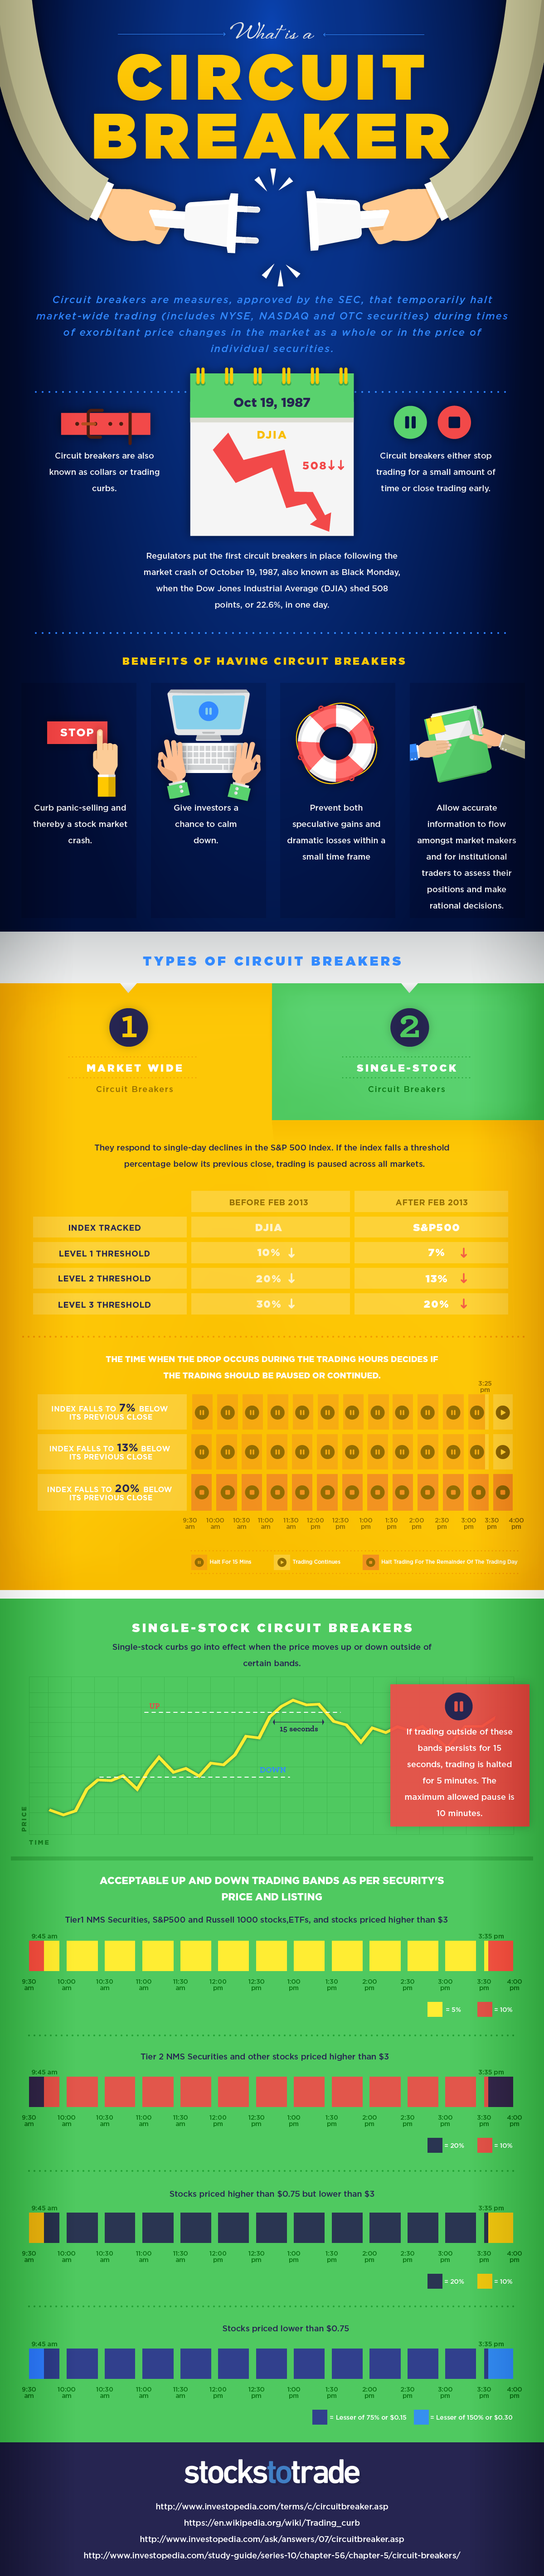
These temporary halts in trading, or “circuit breakers”, are measures approved by the SEC to calm down markets in the event of extreme volatility. The rules apply to NYSE, Nasdaq, and OTC markets, and were put in place following the events of Black Monday in 1987.
Circuit Breaker Rules
Previously, the Dow Jones Industrial Average (DJIA) was the bellwether for such market interventions.
However, the most recent rules apply to the whole market when a precipitous drop in the S&P 500 occurs:
| Before Feb 2013 | After Feb 2013 | |
|---|---|---|
| Index Tracked | DJIA | S&P 500 |
| Level 1 Threshold | -10% | -7% |
| Level 2 Threshold | -20% | -13% |
| Level 3 Threshold | -30% | -20% |
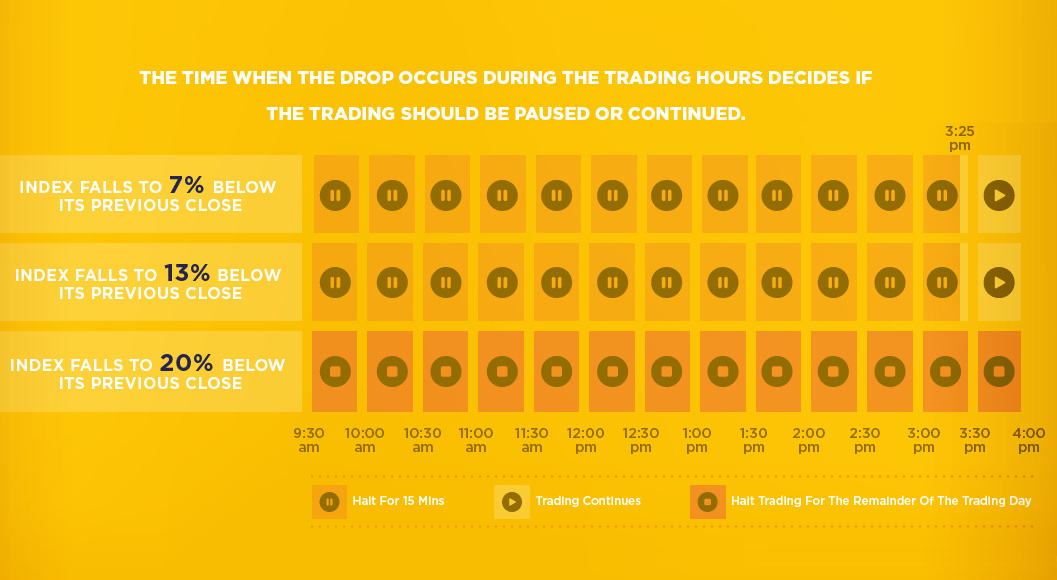
Upon reaching each of the two first thresholds, a 15-minute halt in trading is prompted. This is the case unless the drop happens in the last 35 minutes of trading.
Upon reaching the third threshold (-20% drop in S&P 500), the day’s trading is stopped altogether.
Can Circuit Breakers Stop a Market Crash?
In theory, the use of circuit breakers can help curb panic-selling, as well as limit opportunities for massive gains (or losses) within a short time frame. Further, by creating a window where trading is paused, circuit breakers help make time for market makers and institutional traders to make rational decisions.
Regulators and exchanges hope that all of this together will give investors a chance to calm down, preventing the next market crash.
But do circuit breakers actually work? While they make logical sense, recent evidence from China paints a murkier picture.
The Illusion of Safety
In Paul Kedrosky’s piece from The New Yorker, titled The Dubious Logic of Stock Market Circuit Breakers, he makes some interesting points on the series of market crashes in China from late-2015 to early-2016.
To understand why circuit breakers can make markets less ‘safe,’ imagine that you’re a Chinese trader on a day when markets are approaching a five-per-cent decline. What do you do?
– Paul Kedrosky, The New Yorker
Kedrosky continues by explaining that a market participant in that situation would try to get as many sell orders in as possible, before the circuit breaker is triggered.
Further, when the markets re-open, the same trader would again sell immediately to avoid the second breaker (which triggers an end in trading for the day). Each time the breakers get triggered, it creates a market memory of the events, and traders try to avoid future shutdowns by selling faster.
Preparation is Key
Whether they work or not, it is essential for investors to understand the rules behind circuit breakers, as well as how markets think and react after these pauses in action.
In the event of a market crash, this preparation could help to make a difference.


Markets
U.S. Debt Interest Payments Reach $1 Trillion
U.S. debt interest payments have surged past the $1 trillion dollar mark, amid high interest rates and an ever-expanding debt burden.


U.S. Debt Interest Payments Reach $1 Trillion
This was originally posted on our Voronoi app. Download the app for free on iOS or Android and discover incredible data-driven charts from a variety of trusted sources.
The cost of paying for America’s national debt crossed the $1 trillion dollar mark in 2023, driven by high interest rates and a record $34 trillion mountain of debt.
Over the last decade, U.S. debt interest payments have more than doubled amid vast government spending during the pandemic crisis. As debt payments continue to soar, the Congressional Budget Office (CBO) reported that debt servicing costs surpassed defense spending for the first time ever this year.
This graphic shows the sharp rise in U.S. debt payments, based on data from the Federal Reserve.
A $1 Trillion Interest Bill, and Growing
Below, we show how U.S. debt interest payments have risen at a faster pace than at another time in modern history:
| Date | Interest Payments | U.S. National Debt |
|---|---|---|
| 2023 | $1.0T | $34.0T |
| 2022 | $830B | $31.4T |
| 2021 | $612B | $29.6T |
| 2020 | $518B | $27.7T |
| 2019 | $564B | $23.2T |
| 2018 | $571B | $22.0T |
| 2017 | $493B | $20.5T |
| 2016 | $460B | $20.0T |
| 2015 | $435B | $18.9T |
| 2014 | $442B | $18.1T |
| 2013 | $425B | $17.2T |
| 2012 | $417B | $16.4T |
| 2011 | $433B | $15.2T |
| 2010 | $400B | $14.0T |
| 2009 | $354B | $12.3T |
| 2008 | $380B | $10.7T |
| 2007 | $414B | $9.2T |
| 2006 | $387B | $8.7T |
| 2005 | $355B | $8.2T |
| 2004 | $318B | $7.6T |
| 2003 | $294B | $7.0T |
| 2002 | $298B | $6.4T |
| 2001 | $318B | $5.9T |
| 2000 | $353B | $5.7T |
| 1999 | $353B | $5.8T |
| 1998 | $360B | $5.6T |
| 1997 | $368B | $5.5T |
| 1996 | $362B | $5.3T |
| 1995 | $357B | $5.0T |
| 1994 | $334B | $4.8T |
| 1993 | $311B | $4.5T |
| 1992 | $306B | $4.2T |
| 1991 | $308B | $3.8T |
| 1990 | $298B | $3.4T |
| 1989 | $275B | $3.0T |
| 1988 | $254B | $2.7T |
| 1987 | $240B | $2.4T |
| 1986 | $225B | $2.2T |
| 1985 | $219B | $1.9T |
| 1984 | $205B | $1.7T |
| 1983 | $176B | $1.4T |
| 1982 | $157B | $1.2T |
| 1981 | $142B | $1.0T |
| 1980 | $113B | $930.2B |
| 1979 | $96B | $845.1B |
| 1978 | $84B | $789.2B |
| 1977 | $69B | $718.9B |
| 1976 | $61B | $653.5B |
| 1975 | $55B | $576.6B |
| 1974 | $50B | $492.7B |
| 1973 | $45B | $469.1B |
| 1972 | $39B | $448.5B |
| 1971 | $36B | $424.1B |
| 1970 | $35B | $389.2B |
| 1969 | $30B | $368.2B |
| 1968 | $25B | $358.0B |
| 1967 | $23B | $344.7B |
| 1966 | $21B | $329.3B |
Interest payments represent seasonally adjusted annual rate at the end of Q4.
At current rates, the U.S. national debt is growing by a remarkable $1 trillion about every 100 days, equal to roughly $3.6 trillion per year.
As the national debt has ballooned, debt payments even exceeded Medicaid outlays in 2023—one of the government’s largest expenditures. On average, the U.S. spent more than $2 billion per day on interest costs last year. Going further, the U.S. government is projected to spend a historic $12.4 trillion on interest payments over the next decade, averaging about $37,100 per American.
Exacerbating matters is that the U.S. is running a steep deficit, which stood at $1.1 trillion for the first six months of fiscal 2024. This has accelerated due to the 43% increase in debt servicing costs along with a $31 billion dollar increase in defense spending from a year earlier. Additionally, a $30 billion increase in funding for the Federal Deposit Insurance Corporation in light of the regional banking crisis last year was a major contributor to the deficit increase.
Overall, the CBO forecasts that roughly 75% of the federal deficit’s increase will be due to interest costs by 2034.

-

 Mining2 weeks ago
Charted: The Value Gap Between the Gold Price and Gold Miners
-

 Real Estate1 week ago
Ranked: The Most Valuable Housing Markets in America
-

 Business1 week ago
Charted: Big Four Market Share by S&P 500 Audits
-

 AI1 week ago
The Stock Performance of U.S. Chipmakers So Far in 2024
-

 Misc1 week ago
Almost Every EV Stock is Down After Q1 2024
-

 Money2 weeks ago
Where Does One U.S. Tax Dollar Go?
-

 Green2 weeks ago
Ranked: Top Countries by Total Forest Loss Since 2001
-

 Markets2 weeks ago
Visualizing America’s Shortage of Affordable Homes