Markets
The Great Lakes Economy: The Growth Engine of North America
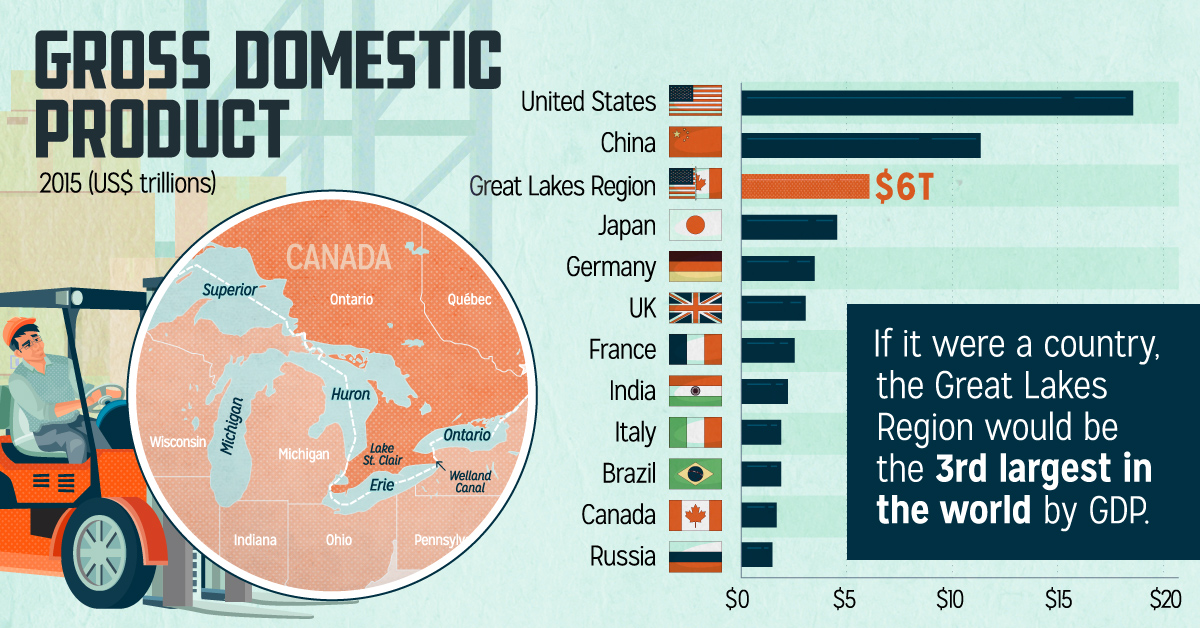
We don’t often think about the states and Canadian provinces surrounding the Great Lakes as its own economy – but maybe we should.
After all, the region is tightly integrated in terms of trade. It alone accounts for more than 50% of all U.S./Canadian bilateral border trade and sees over 200 million tons of cargo shipped annually. If it were its own country, it would have a GDP of US$6 trillion – making it the third biggest economy in the world.
An Economic Powerhouse
Today’s infographic comes from the Council of the Great Lakes Region, and it breaks down the massive economic impact and trade partnerships that stem from the region’s prolific waterways, and the people living around them.

The Great Lakes Region has always been a center of trade. From the fur trade of the 17th century to modern day, the area’s navigable terrain, waterways, and ports have made it an easy place for goods to exchange hands.
Overview: The Great Lakes Economy
The Great Lakes Region includes eight states (Minnesota, Wisconsin, Illinois, Indiana, Michigan, New York, Ohio, and Pennsylvania) and two Canadian provinces (Ontario and Quebec) that surround the five interconnected freshwater bodies known as the Great Lakes. The area is home to 107 million people, 51 million jobs, and a GDP of US$6 trillion – making the Great Lakes Economy a powerhouse on an international level.
In particular, the region is well-known globally for its manufacturing prowess. It’s home to automobile and aerospace giants like Ford, GM, Chrysler, Bombardier, GE Aviation, and Magna International, and also many other diverse industries. Education and health, shipping and logistics, agriculture, mining and energy, tourism, and finance are some of the other major industries that generate business for the region.
And despite having a border, the Great Lakes Economy is highly integrated. Each year, there is $278 billion in bilateral U.S.-Canadian trade in the Great Lakes area – more than the entire region trades with countries like Mexico, China, UK, Germany and Japan combined.
Cross-Border Customers
The relationship between U.S. states and Canadian provinces in the Great Lakes Region is unique, and relies on goods flowing both ways.
For U.S. companies in the region, 78% of the imports they bring in from Canada are “intermediate goods”, which are raw materials, parts and components, and services that are used to produce other goods and services in the United States.
Here’s a breakdown of Canadian intermediate goods bought by U.S. states:
| Rank | State | Canadian imports (Intermediate Goods, $USD) |
|---|---|---|
| #1 | Illinois | $25.5 billion |
| #2 | Michigan | $15.7 billion |
| #3 | New York | $11.6 billion |
| #4 | Ohio | $9.9 billion |
| #5 | Minnesota | $7.6 billion |
| #6 | Pennsylvania | $7.4 billion |
| #7 | Indiana | $5.3 billion |
| #8 | Wisconsin | $3.0 billion |
| Total | $86.0 billion |
Going the other way, Canadians buy billions of dollars worth of goods from the Great Lake states as well.
In fact, Canada is actually the biggest international customer for each state in the region – something we’ve previously shown in our USA/Canada trade infographic as well.
Bridge Over Troubled Water
Although rhetoric against the U.S./Canadian trade relationship has ramped up in the recent months, there is still one enduring symbol that exemplifies the intimate trade relationship of the two countries in the Great Lakes Economy: the Ambassador Bridge between Detroit, Michigan and Windsor, Ontario.
Each day, over this one 1.3 mi (2.3 km) suspension bridge alone, close to 10,000 trucks pass to generate close to US$500 million of international trade between the two nations.
That’s equal to 25% of all bilateral trade between Canada and the U.S. Amazingly, more bilateral trade happens over this single bridge than the U.S. does in its entirety with France, Germany, South Korea, or the United Kingdom.


Markets
U.S. Debt Interest Payments Reach $1 Trillion
U.S. debt interest payments have surged past the $1 trillion dollar mark, amid high interest rates and an ever-expanding debt burden.


U.S. Debt Interest Payments Reach $1 Trillion
This was originally posted on our Voronoi app. Download the app for free on iOS or Android and discover incredible data-driven charts from a variety of trusted sources.
The cost of paying for America’s national debt crossed the $1 trillion dollar mark in 2023, driven by high interest rates and a record $34 trillion mountain of debt.
Over the last decade, U.S. debt interest payments have more than doubled amid vast government spending during the pandemic crisis. As debt payments continue to soar, the Congressional Budget Office (CBO) reported that debt servicing costs surpassed defense spending for the first time ever this year.
This graphic shows the sharp rise in U.S. debt payments, based on data from the Federal Reserve.
A $1 Trillion Interest Bill, and Growing
Below, we show how U.S. debt interest payments have risen at a faster pace than at another time in modern history:
| Date | Interest Payments | U.S. National Debt |
|---|---|---|
| 2023 | $1.0T | $34.0T |
| 2022 | $830B | $31.4T |
| 2021 | $612B | $29.6T |
| 2020 | $518B | $27.7T |
| 2019 | $564B | $23.2T |
| 2018 | $571B | $22.0T |
| 2017 | $493B | $20.5T |
| 2016 | $460B | $20.0T |
| 2015 | $435B | $18.9T |
| 2014 | $442B | $18.1T |
| 2013 | $425B | $17.2T |
| 2012 | $417B | $16.4T |
| 2011 | $433B | $15.2T |
| 2010 | $400B | $14.0T |
| 2009 | $354B | $12.3T |
| 2008 | $380B | $10.7T |
| 2007 | $414B | $9.2T |
| 2006 | $387B | $8.7T |
| 2005 | $355B | $8.2T |
| 2004 | $318B | $7.6T |
| 2003 | $294B | $7.0T |
| 2002 | $298B | $6.4T |
| 2001 | $318B | $5.9T |
| 2000 | $353B | $5.7T |
| 1999 | $353B | $5.8T |
| 1998 | $360B | $5.6T |
| 1997 | $368B | $5.5T |
| 1996 | $362B | $5.3T |
| 1995 | $357B | $5.0T |
| 1994 | $334B | $4.8T |
| 1993 | $311B | $4.5T |
| 1992 | $306B | $4.2T |
| 1991 | $308B | $3.8T |
| 1990 | $298B | $3.4T |
| 1989 | $275B | $3.0T |
| 1988 | $254B | $2.7T |
| 1987 | $240B | $2.4T |
| 1986 | $225B | $2.2T |
| 1985 | $219B | $1.9T |
| 1984 | $205B | $1.7T |
| 1983 | $176B | $1.4T |
| 1982 | $157B | $1.2T |
| 1981 | $142B | $1.0T |
| 1980 | $113B | $930.2B |
| 1979 | $96B | $845.1B |
| 1978 | $84B | $789.2B |
| 1977 | $69B | $718.9B |
| 1976 | $61B | $653.5B |
| 1975 | $55B | $576.6B |
| 1974 | $50B | $492.7B |
| 1973 | $45B | $469.1B |
| 1972 | $39B | $448.5B |
| 1971 | $36B | $424.1B |
| 1970 | $35B | $389.2B |
| 1969 | $30B | $368.2B |
| 1968 | $25B | $358.0B |
| 1967 | $23B | $344.7B |
| 1966 | $21B | $329.3B |
Interest payments represent seasonally adjusted annual rate at the end of Q4.
At current rates, the U.S. national debt is growing by a remarkable $1 trillion about every 100 days, equal to roughly $3.6 trillion per year.
As the national debt has ballooned, debt payments even exceeded Medicaid outlays in 2023—one of the government’s largest expenditures. On average, the U.S. spent more than $2 billion per day on interest costs last year. Going further, the U.S. government is projected to spend a historic $12.4 trillion on interest payments over the next decade, averaging about $37,100 per American.
Exacerbating matters is that the U.S. is running a steep deficit, which stood at $1.1 trillion for the first six months of fiscal 2024. This has accelerated due to the 43% increase in debt servicing costs along with a $31 billion dollar increase in defense spending from a year earlier. Additionally, a $30 billion increase in funding for the Federal Deposit Insurance Corporation in light of the regional banking crisis last year was a major contributor to the deficit increase.
Overall, the CBO forecasts that roughly 75% of the federal deficit’s increase will be due to interest costs by 2034.

-

 Mining2 weeks ago
Charted: The Value Gap Between the Gold Price and Gold Miners
-

 Real Estate1 week ago
Ranked: The Most Valuable Housing Markets in America
-

 Business1 week ago
Charted: Big Four Market Share by S&P 500 Audits
-

 AI1 week ago
The Stock Performance of U.S. Chipmakers So Far in 2024
-

 Misc1 week ago
Almost Every EV Stock is Down After Q1 2024
-

 Money2 weeks ago
Where Does One U.S. Tax Dollar Go?
-

 Green2 weeks ago
Ranked: Top Countries by Total Forest Loss Since 2001
-

 Real Estate2 weeks ago
Visualizing America’s Shortage of Affordable Homes