Gold
Gold and Silver Dealer Hedging
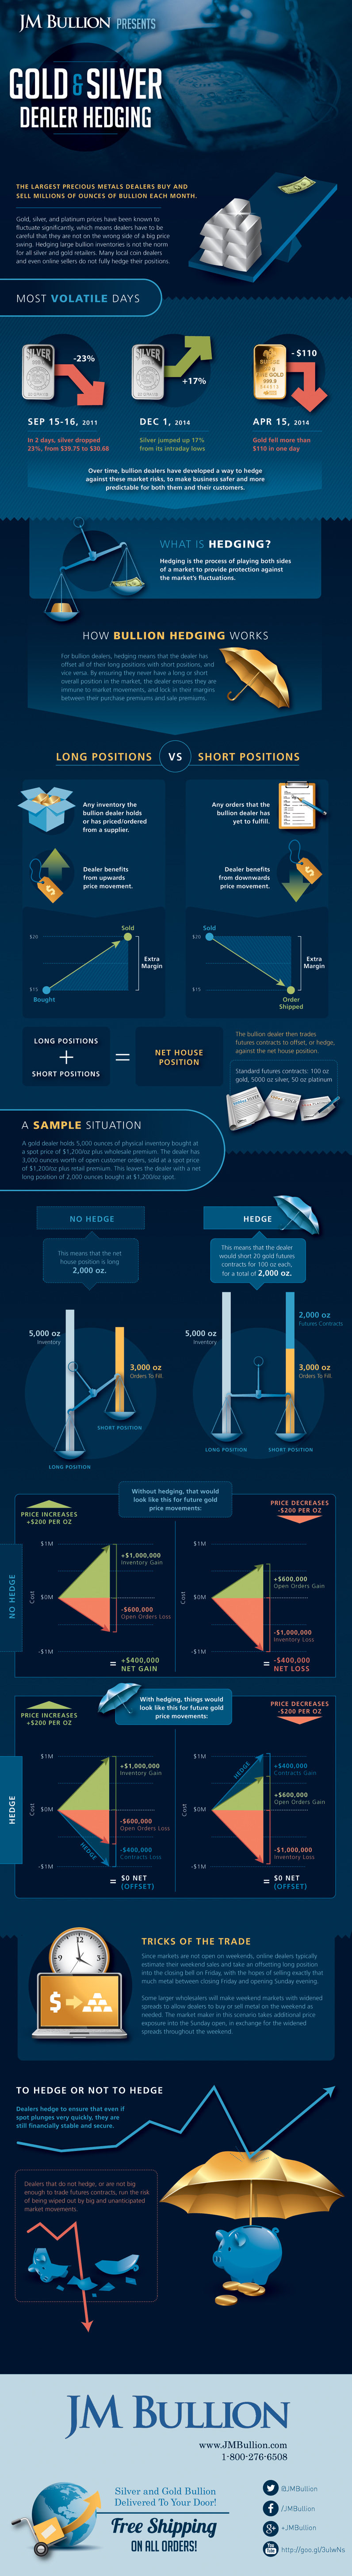
Gold and Silver Dealer Hedging
Gold, silver, and platinum prices have been known to fluctuate significantly. Just last year, for example, the gold price dropped $110 in just one day (April 15th). Later on in 2014, the typically more volatile silver jumped 17% from its intraday lows in the course of a day (Dec 1st).
The largest precious metals dealers buy and sell millions of ounces of bullion each month, which means they have to be careful that they are not on the wrong side of one of these big price swings. Large price movements, both up and down, can potentially wipe out or endanger smaller dealers that aren’t careful with their inventory.
Over time, bullion dealers have developed a way to hedge against these market risks, to make business safer and more predictable for both them and their customers.
What is Hedging?
Hedging is the process of playing both sides of a market to provide protection against the market’s fluctuations.
For bullion dealers, hedging means that the dealer has to offset all of their long positions with short positions, and vice versa. By ensuring they never have a long or short overall position in the market, the dealer ensures they are immune to market movements, and lock in their margins between their purchase premiums and sale premiums.
Long positions: Any inventory the bullion dealer holds or has priced/ordered from a supplier. The dealer benefits from upwards price movement in the gold or silver price.
Short positions: Any orders that the bullion dealer has yet to fulfill. The dealer benefits from downwards price movement in the gold or silver price.
Net house position: Equal to the bullion dealer’s long position minus short position.
A Sample Situation
A gold dealer holds 5,000 ounces of physical inventory bought at a spot price of $1,200/oz plus wholesale premium. The dealer has 3,000 ounces worth of open customer orders, sold at a spot price of $1,200/oz plus retail premium. This leaves the dealer with a net long position of 2,000 ounces bought at $1,200/oz spot.
With no hedging, the dealer has a net long house position of 2,000 oz.
With hedging, the dealer offsets this position by shorting 20 gold futures contracts for 100 oz gold each, for a total short of 2,000 oz.
If the price of gold swings $200, it will have an unanticipated $400,000 positive or negative effect on the dealer who does not hedge. For the dealer that hedges the net long position with short futures contracts, everything will be a wash. This allows the dealer to not have to worry about swings, and instead to focus on making margin on premiums alone.
A Sample Situation
Since markets are not open on weekends, online dealers typically estimate their weekend sales and take an offsetting long position into the closing bell on Friday, with the hopes of selling exactly that much metal between closing Friday and opening Sunday evening.
Some larger wholesalers will make weekend markets with widened spreads to allow dealers to buy or sell metal on the weekend as needed. The market maker in this scenario takes additional price exposure into the Sunday open, in exchange for the widened spreads throughout the weekend.
To Hedge or Not to Hedge
Dealers hedge to ensure that even if spot plunges very quickly, they are still financially stable and secure.
Dealers that do not hedge, or are not big enough to trade futures contracts, run the risk of being wiped out by big and unanticipated market movements.
Hedging large bullion inventories is not the norm for all silver and gold retailers. Many local coin dealers and even online sellers do not fully hedge their positions.


Mining
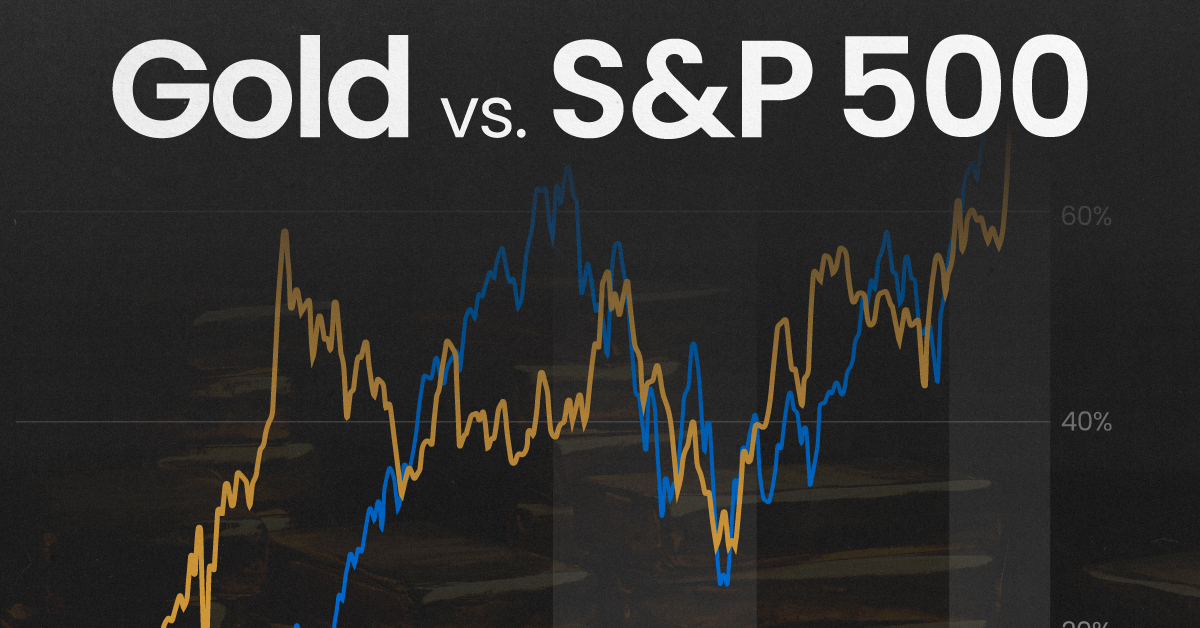
Gold vs. S&P 500: Which Has Grown More Over Five Years?
The price of gold has set record highs in 2024, but how has this precious metal performed relative to the S&P 500?

Gold vs. S&P 500: Which Has Grown More Over Five Years?
This was originally posted on our Voronoi app. Download the app for free on Apple or Android and discover incredible data-driven charts from a variety of trusted sources.
Gold is considered a unique asset due to its enduring value, historical significance, and application in various technologies like computers, spacecraft, and communications equipment.
Commonly regarded as a “safe haven asset”, gold is something investors typically buy to protect themselves during periods of global uncertainty and economic decline.
It is for this reason that gold has performed rather strongly in recent years, and especially in 2024. Persistent inflation combined with multiple wars has driven up demand for gold, helping it set a new all-time high of over $2,400 per ounce.
To put this into perspective, we visualized the performance of gold alongside the S&P 500. See the table below for performance figures as of April 12, 2024.
| Asset/Index | 1 Yr (%) | 5 Yr (%) |
|---|---|---|
| 🏆 Gold | +16.35 | +81.65 |
| 💼 S&P 500 | +25.21 | +76.22 |
Over the five-year period, gold has climbed an impressive 81.65%, outpacing even the S&P 500.
Get Your Gold at Costco
Perhaps a sign of how high the demand for gold is becoming, wholesale giant Costco is reportedly selling up to $200 million worth of gold bars every month in the United States. The year prior, sales only amounted to $100 million per quarter.
Consumers aren’t the only ones buying gold, either. Central banks around the world have been accumulating gold in very large quantities, likely as a hedge against inflation.
According to the World Gold Council, these institutions bought 1,136 metric tons in 2022, marking the highest level since 1950. Figures for 2023 came in at 1,037 metric tons.
See More Graphics on Gold
If you’re fascinated by gold, be sure to check out more Visual Capitalist content including 200 Years of Global Gold Production, by Country or Ranked: The Largest Gold Reserves by Country.

-

 Mining1 week ago
Gold vs. S&P 500: Which Has Grown More Over Five Years?
-

 Markets2 weeks ago
Ranked: The Most Valuable Housing Markets in America
-

 Money2 weeks ago
Which States Have the Highest Minimum Wage in America?
-

 AI2 weeks ago
Ranked: Semiconductor Companies by Industry Revenue Share
-

 Markets2 weeks ago
Ranked: The World’s Top Flight Routes, by Revenue
-

 Countries2 weeks ago
Population Projections: The World’s 6 Largest Countries in 2075
-

 Markets2 weeks ago
The Top 10 States by Real GDP Growth in 2023
-

 Demographics2 weeks ago
The Smallest Gender Wage Gaps in OECD Countries