Markets
The Biggest Global Risks of 2023


The Biggest Global Risks of 2023
The profile of risks facing the world is evolving constantly. Events like last year’s invasion of Ukraine can send shockwaves through the system, radically shifting perceptions of what the biggest risks facing humanity are.
Today’s graphic summarizes findings from the Global Risks Report, an annual publication produced by the World Economic Forum (WEF). It provides an overview of the most pressing global risks that the world is facing, as identified by experts and decision-makers.
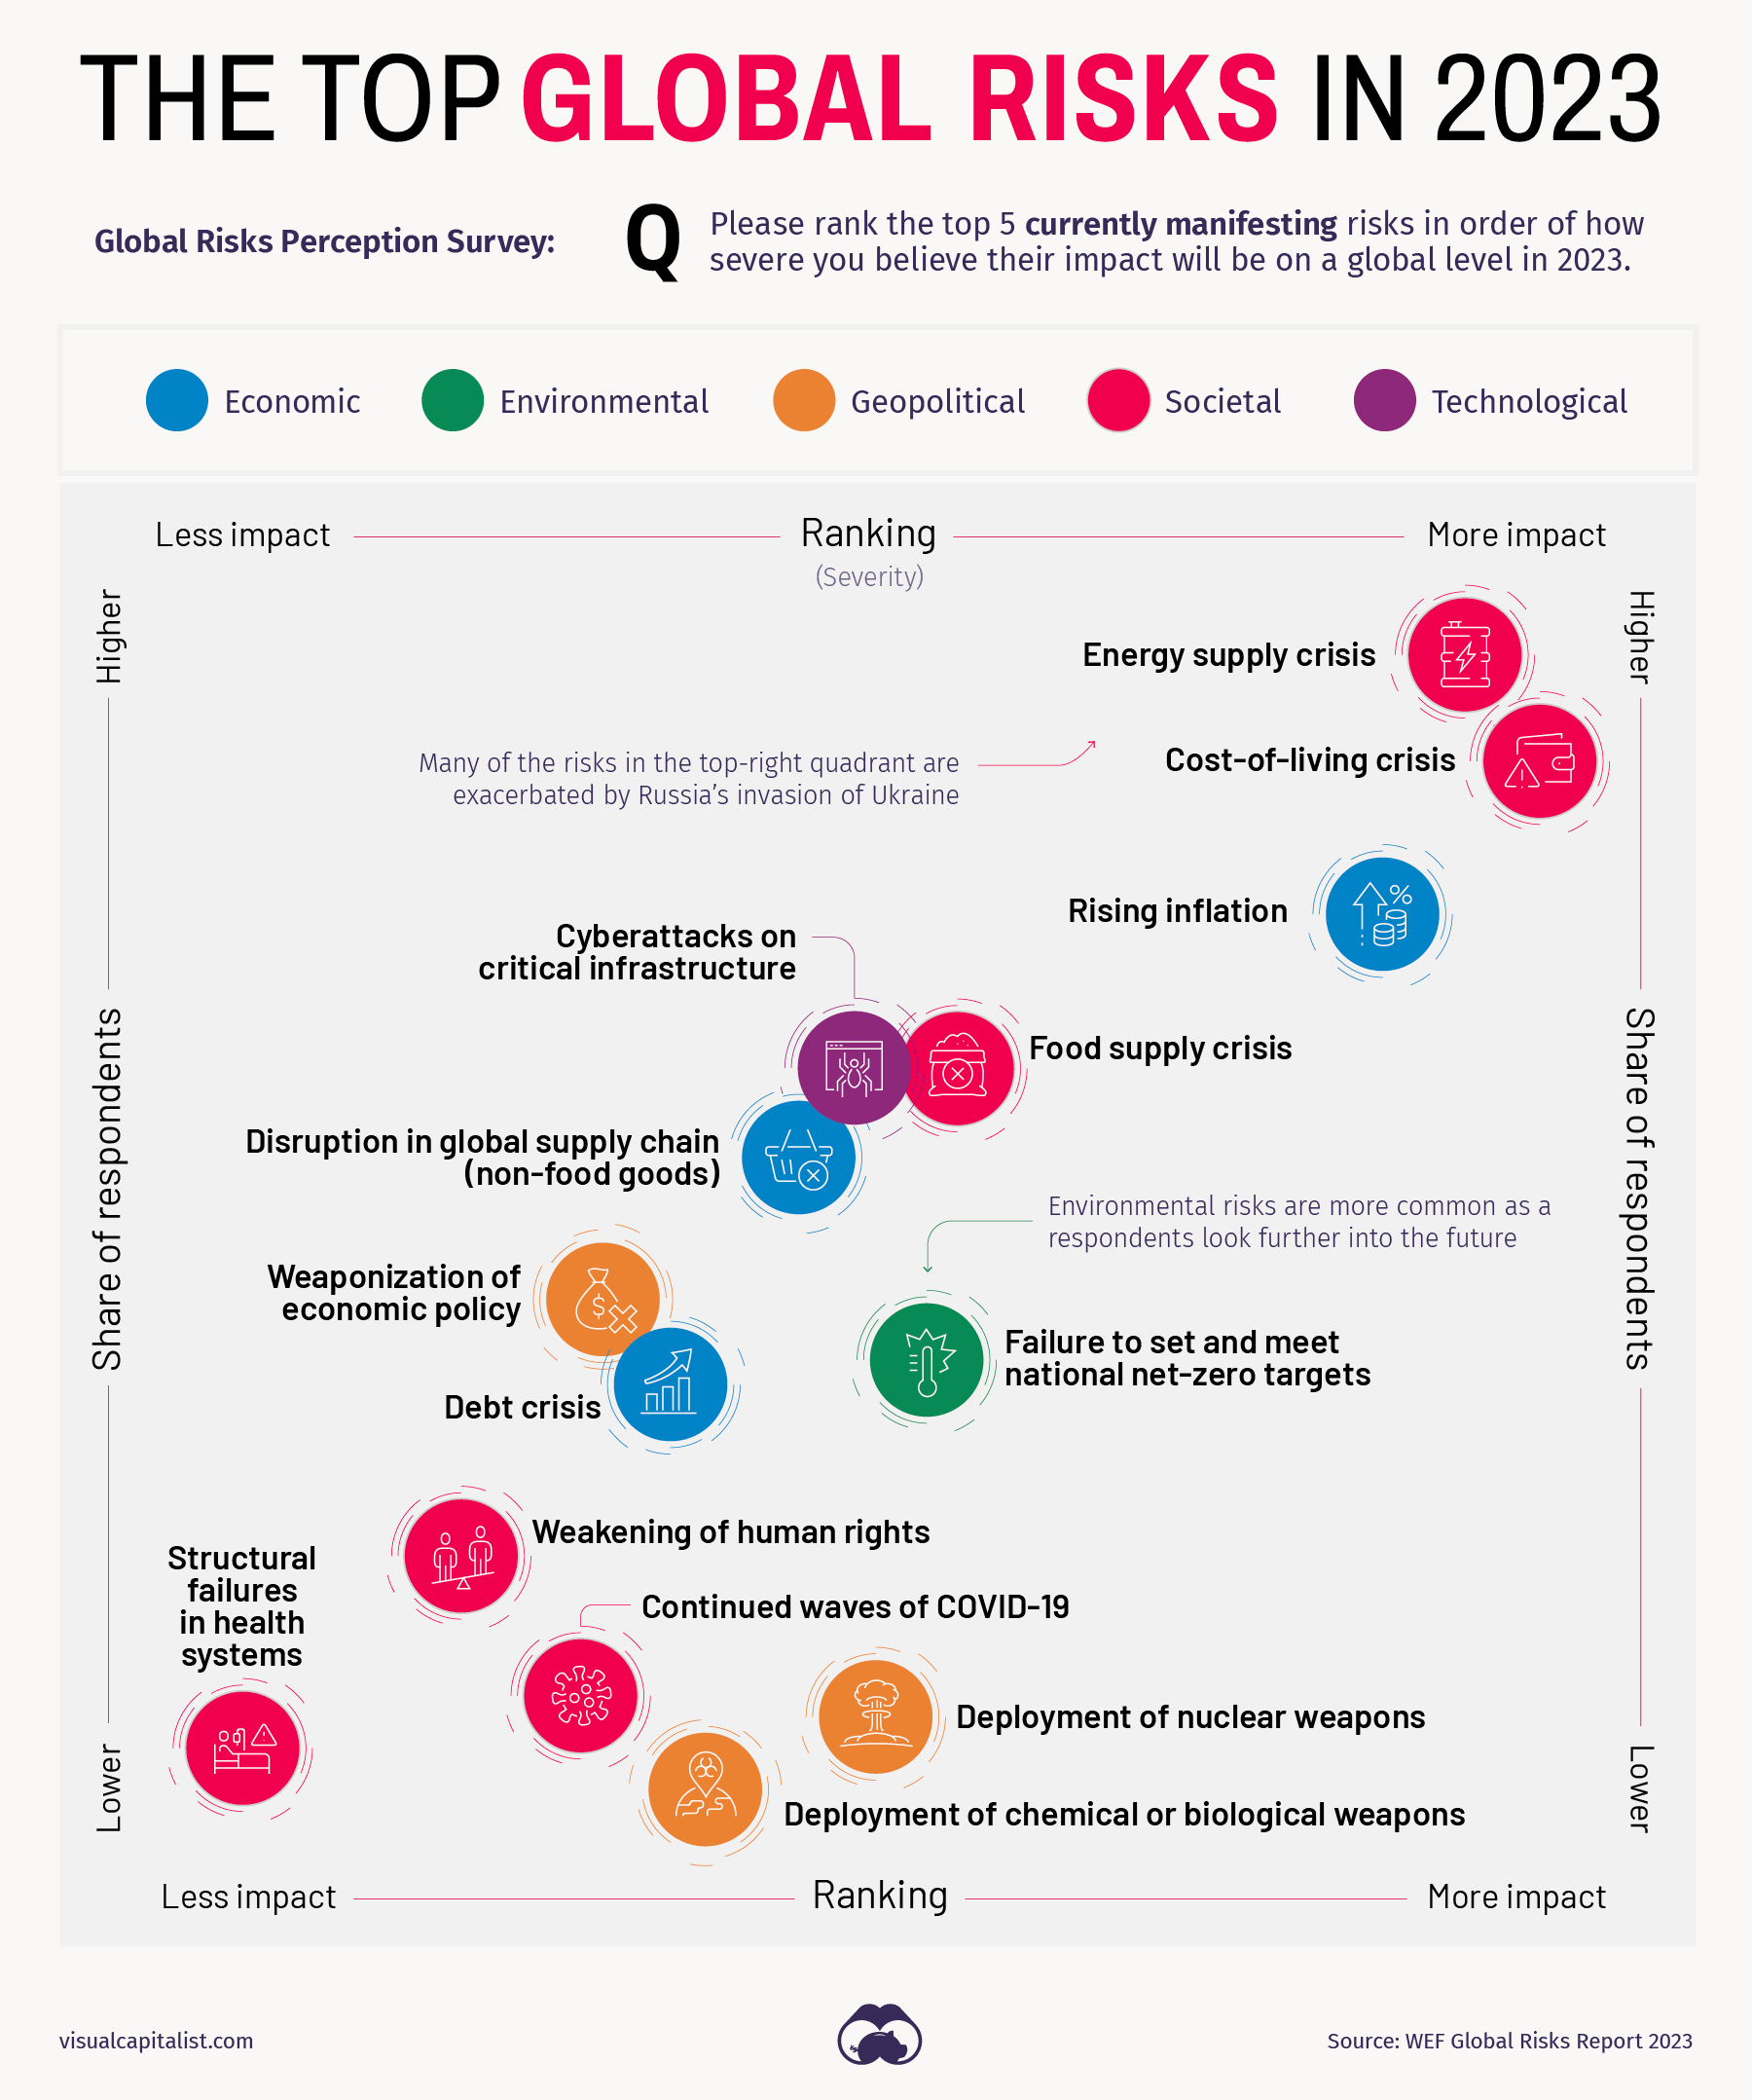
These risks are grouped into five general categories: economic, environmental, geopolitical, societal, and technological.
Let’s dive into this year’s findings.
2023’s Risk Profile
In the lower–middle portion of the chart are the risks that could have serious impacts—such as attacks involving nuclear or biological weapons—but that were highlighted by fewer experts.
Over in the top-right quadrant of the chart are the risks that a number of experts mentioned, and that are causing a strain on society. Not surprisingly, the top risks are related to issues that impact a wide variety of people, such as the rising cost of living and inflation. When staples like food and energy become more expensive, this can fuel unrest and political instability—particularly in countries that already had simmering discontent. WEF points out that increases in fuel prices alone led to protests in an estimated 92 countries.
One risk worth watching is geoeconomic confrontation, which includes sanctions, trade wars, investment screening, and other actions that have the intent of weakening the countries on the receiving end. Efforts to mitigate this risk result in some of the key themes we see for the coming year. One example is the onshoring of industries, and “friend-shoring”, which is essentially moving operations to a foreign country that has more stable relations with one’s home country.
How Prepared Are We?
It’s one thing to be aware of risks, but it’s quite another to have the ability to head off negative events when they come to fruition.
The chart below is a look at how prepared we are globally to deal with specific types of risks that could arise in the next few years.
At the top of the chart are risks that experts feel society is better equipped to handle with current plans and resources. Moving towards the bottom of the chart are risks that experts feel are more of a threat since mechanisms for handling them are weak or non-existent.
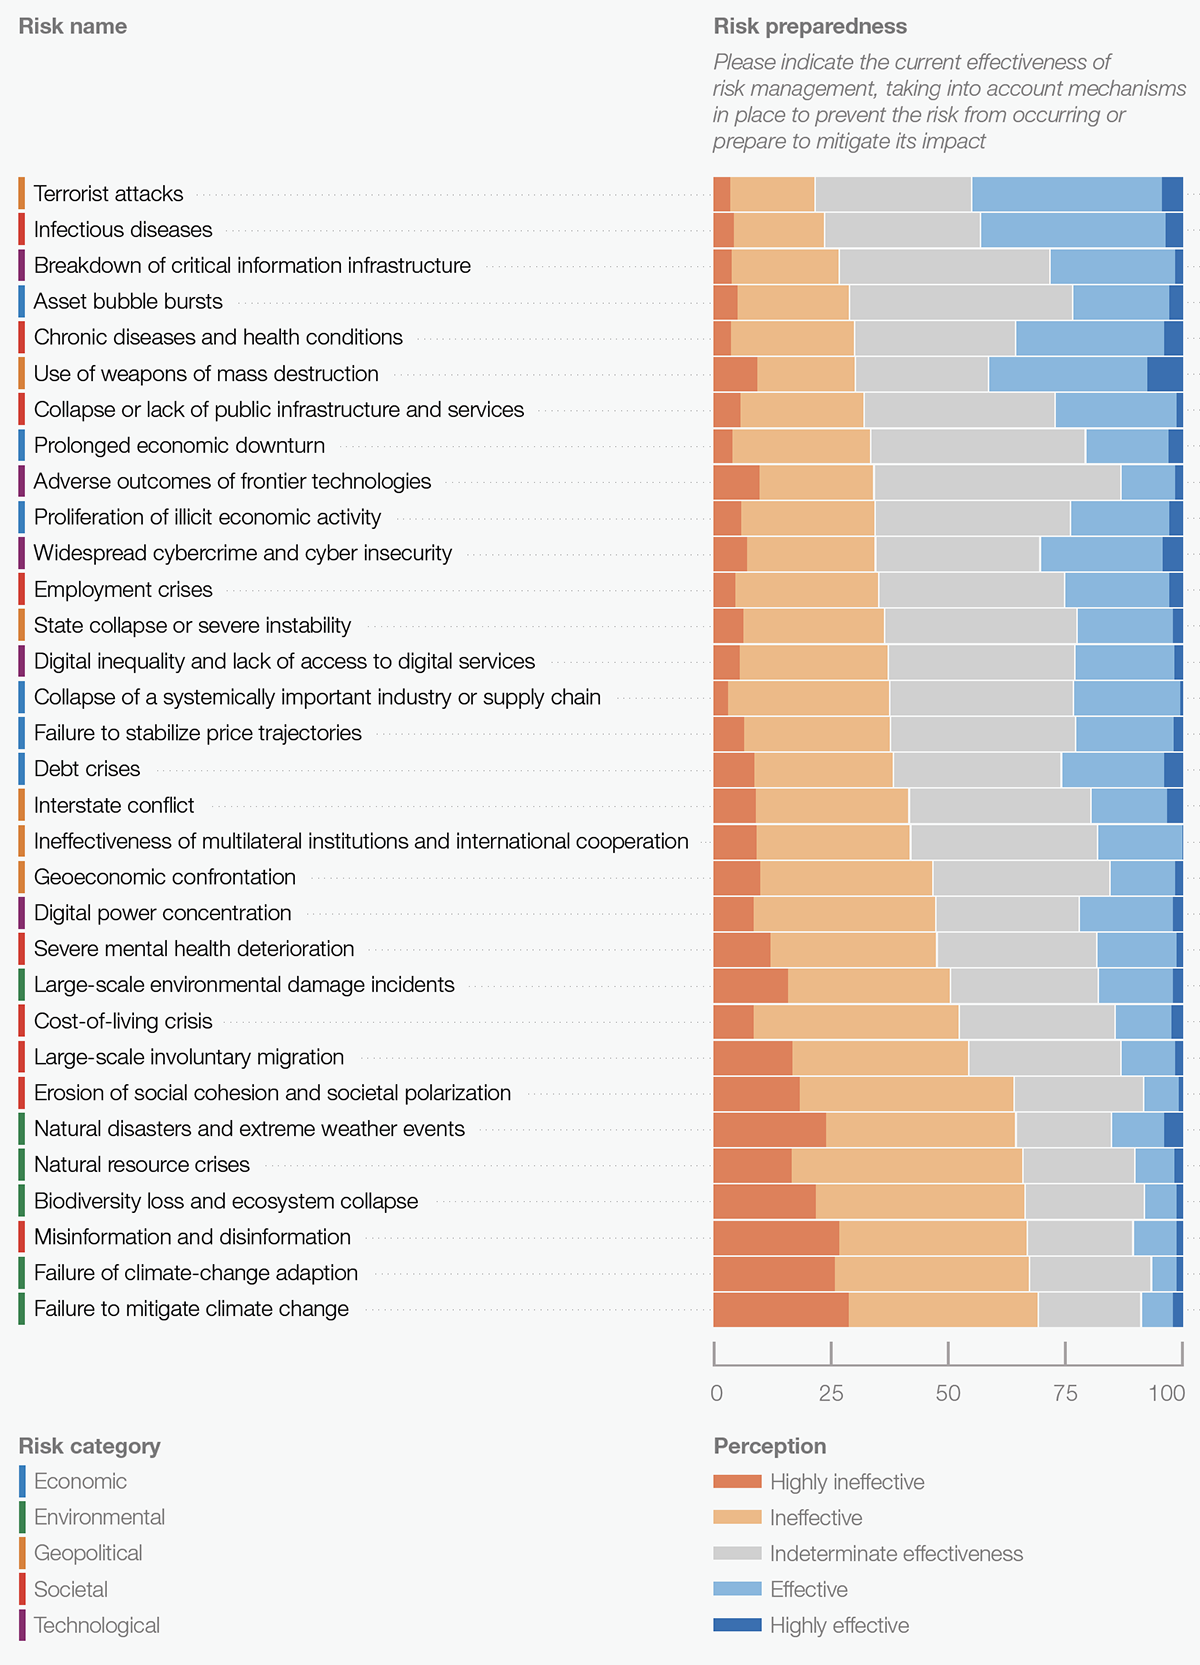
Experts are generally more confident in solutions in the military or healthcare domains. Environmental and societal challenges leave policy and decision-makers less confident.
One telling observation from the data above is that none of the risks left a majority of experts feeling confident in our ability to prevent the risk from occurring, or prepared to mitigate its impact. As the 2020s are shaping up to be a turbulent decade, that could be a cause for concern.
Where does this data come from?
Source: The Global Risks Report 2023, produced by the World Economic Forum (in partnership with Marsh McLennan and Zurich Insurance Group).
Data note: The chart in this article is based on the Global Risks Perception Survey 2022-2023. A list of 32 global risks, along with their definitions, is shown in Table A.1 of the PDF. Page 77 of the report also includes detailed information on sample sizes and demographics of respondents.


Markets
U.S. Debt Interest Payments Reach $1 Trillion
U.S. debt interest payments have surged past the $1 trillion dollar mark, amid high interest rates and an ever-expanding debt burden.


U.S. Debt Interest Payments Reach $1 Trillion
This was originally posted on our Voronoi app. Download the app for free on iOS or Android and discover incredible data-driven charts from a variety of trusted sources.
The cost of paying for America’s national debt crossed the $1 trillion dollar mark in 2023, driven by high interest rates and a record $34 trillion mountain of debt.
Over the last decade, U.S. debt interest payments have more than doubled amid vast government spending during the pandemic crisis. As debt payments continue to soar, the Congressional Budget Office (CBO) reported that debt servicing costs surpassed defense spending for the first time ever this year.
This graphic shows the sharp rise in U.S. debt payments, based on data from the Federal Reserve.
A $1 Trillion Interest Bill, and Growing
Below, we show how U.S. debt interest payments have risen at a faster pace than at another time in modern history:
| Date | Interest Payments | U.S. National Debt |
|---|---|---|
| 2023 | $1.0T | $34.0T |
| 2022 | $830B | $31.4T |
| 2021 | $612B | $29.6T |
| 2020 | $518B | $27.7T |
| 2019 | $564B | $23.2T |
| 2018 | $571B | $22.0T |
| 2017 | $493B | $20.5T |
| 2016 | $460B | $20.0T |
| 2015 | $435B | $18.9T |
| 2014 | $442B | $18.1T |
| 2013 | $425B | $17.2T |
| 2012 | $417B | $16.4T |
| 2011 | $433B | $15.2T |
| 2010 | $400B | $14.0T |
| 2009 | $354B | $12.3T |
| 2008 | $380B | $10.7T |
| 2007 | $414B | $9.2T |
| 2006 | $387B | $8.7T |
| 2005 | $355B | $8.2T |
| 2004 | $318B | $7.6T |
| 2003 | $294B | $7.0T |
| 2002 | $298B | $6.4T |
| 2001 | $318B | $5.9T |
| 2000 | $353B | $5.7T |
| 1999 | $353B | $5.8T |
| 1998 | $360B | $5.6T |
| 1997 | $368B | $5.5T |
| 1996 | $362B | $5.3T |
| 1995 | $357B | $5.0T |
| 1994 | $334B | $4.8T |
| 1993 | $311B | $4.5T |
| 1992 | $306B | $4.2T |
| 1991 | $308B | $3.8T |
| 1990 | $298B | $3.4T |
| 1989 | $275B | $3.0T |
| 1988 | $254B | $2.7T |
| 1987 | $240B | $2.4T |
| 1986 | $225B | $2.2T |
| 1985 | $219B | $1.9T |
| 1984 | $205B | $1.7T |
| 1983 | $176B | $1.4T |
| 1982 | $157B | $1.2T |
| 1981 | $142B | $1.0T |
| 1980 | $113B | $930.2B |
| 1979 | $96B | $845.1B |
| 1978 | $84B | $789.2B |
| 1977 | $69B | $718.9B |
| 1976 | $61B | $653.5B |
| 1975 | $55B | $576.6B |
| 1974 | $50B | $492.7B |
| 1973 | $45B | $469.1B |
| 1972 | $39B | $448.5B |
| 1971 | $36B | $424.1B |
| 1970 | $35B | $389.2B |
| 1969 | $30B | $368.2B |
| 1968 | $25B | $358.0B |
| 1967 | $23B | $344.7B |
| 1966 | $21B | $329.3B |
Interest payments represent seasonally adjusted annual rate at the end of Q4.
At current rates, the U.S. national debt is growing by a remarkable $1 trillion about every 100 days, equal to roughly $3.6 trillion per year.
As the national debt has ballooned, debt payments even exceeded Medicaid outlays in 2023—one of the government’s largest expenditures. On average, the U.S. spent more than $2 billion per day on interest costs last year. Going further, the U.S. government is projected to spend a historic $12.4 trillion on interest payments over the next decade, averaging about $37,100 per American.
Exacerbating matters is that the U.S. is running a steep deficit, which stood at $1.1 trillion for the first six months of fiscal 2024. This has accelerated due to the 43% increase in debt servicing costs along with a $31 billion dollar increase in defense spending from a year earlier. Additionally, a $30 billion increase in funding for the Federal Deposit Insurance Corporation in light of the regional banking crisis last year was a major contributor to the deficit increase.
Overall, the CBO forecasts that roughly 75% of the federal deficit’s increase will be due to interest costs by 2034.

-

 Mining2 weeks ago
Charted: The Value Gap Between the Gold Price and Gold Miners
-

 Real Estate1 week ago
Ranked: The Most Valuable Housing Markets in America
-

 Business1 week ago
Charted: Big Four Market Share by S&P 500 Audits
-

 AI1 week ago
The Stock Performance of U.S. Chipmakers So Far in 2024
-

 Misc1 week ago
Almost Every EV Stock is Down After Q1 2024
-

 Money2 weeks ago
Where Does One U.S. Tax Dollar Go?
-

 Green2 weeks ago
Ranked: Top Countries by Total Forest Loss Since 2001
-

 Real Estate2 weeks ago
Visualizing America’s Shortage of Affordable Homes